Search by Sample ID, location, or drug


-
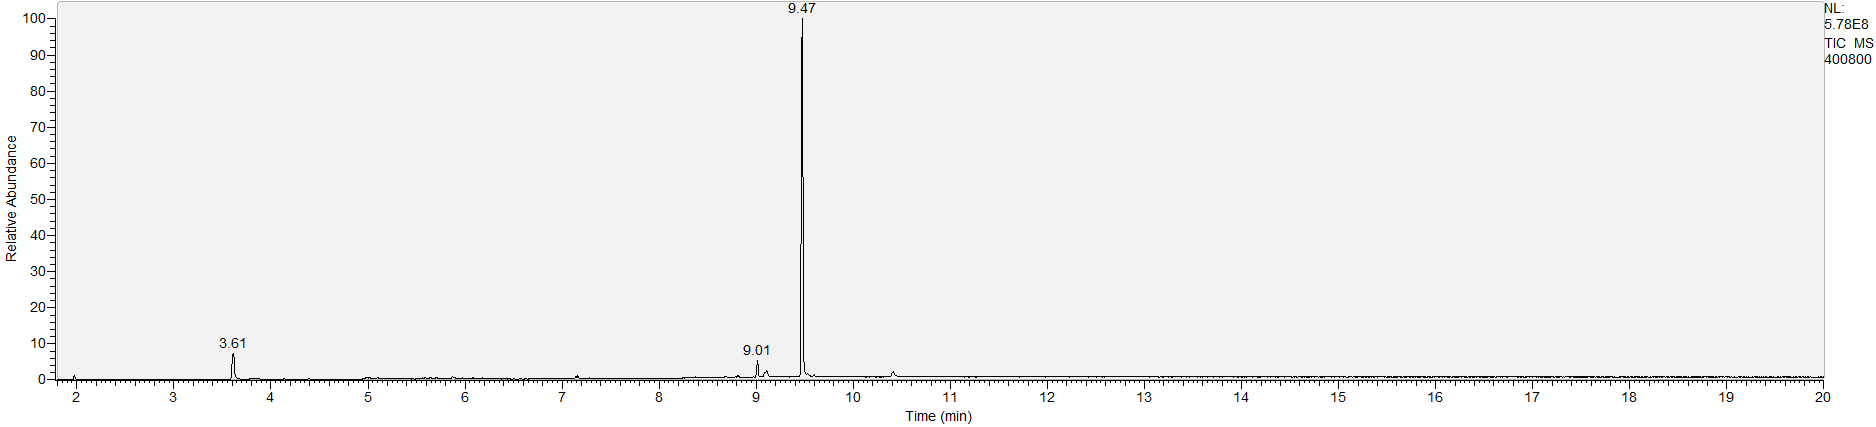
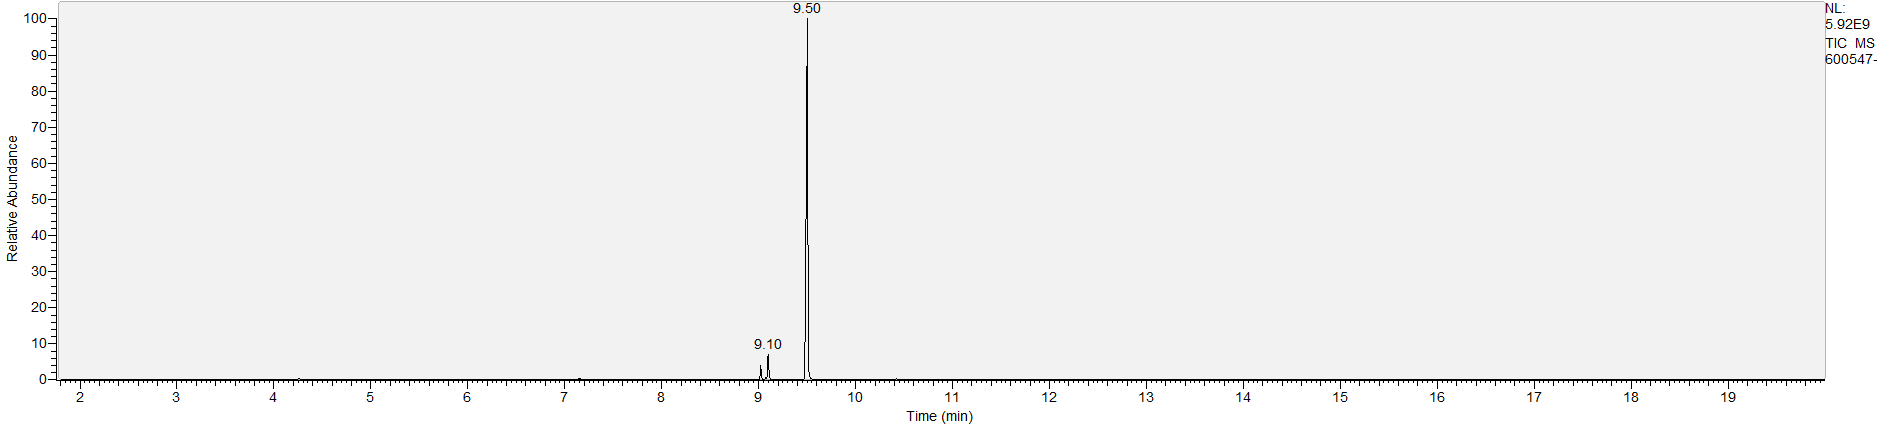
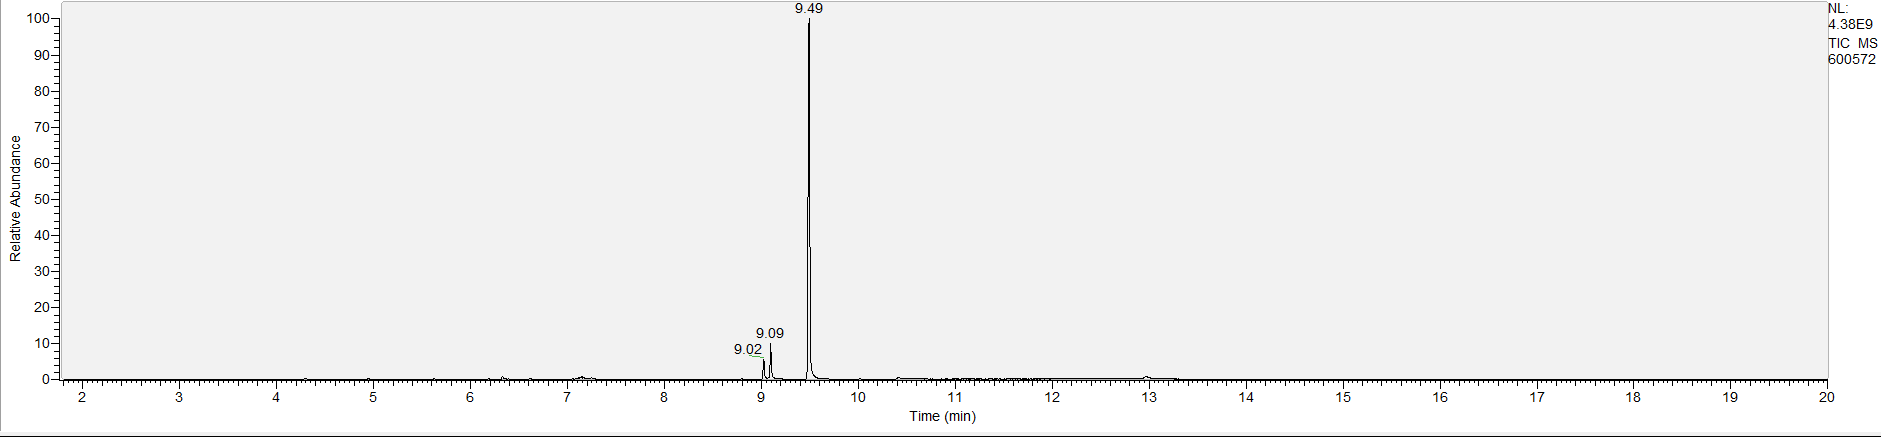
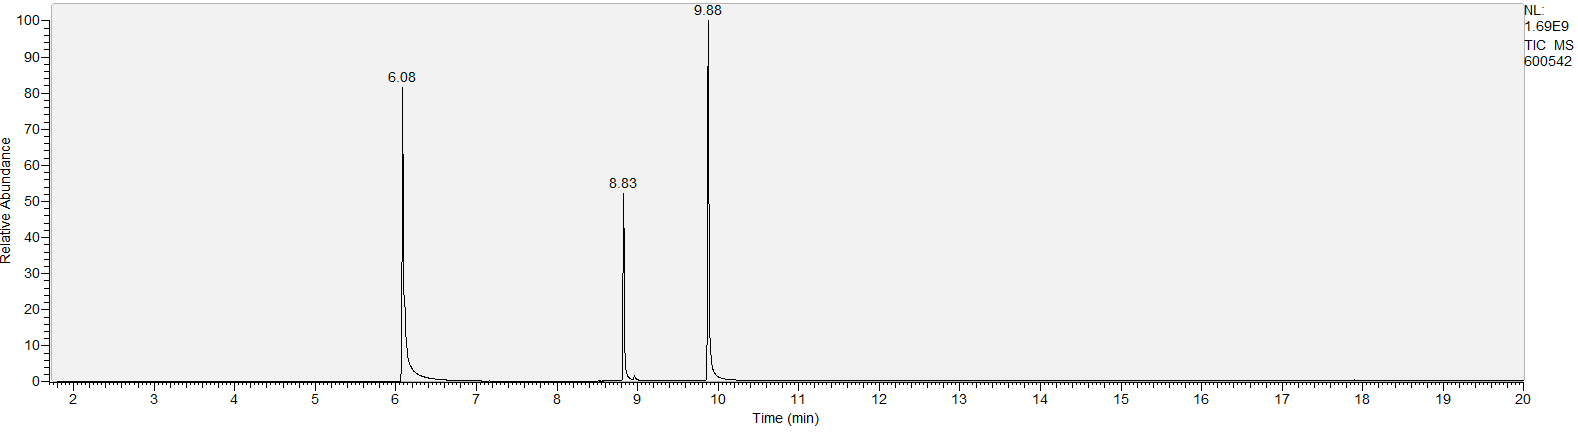
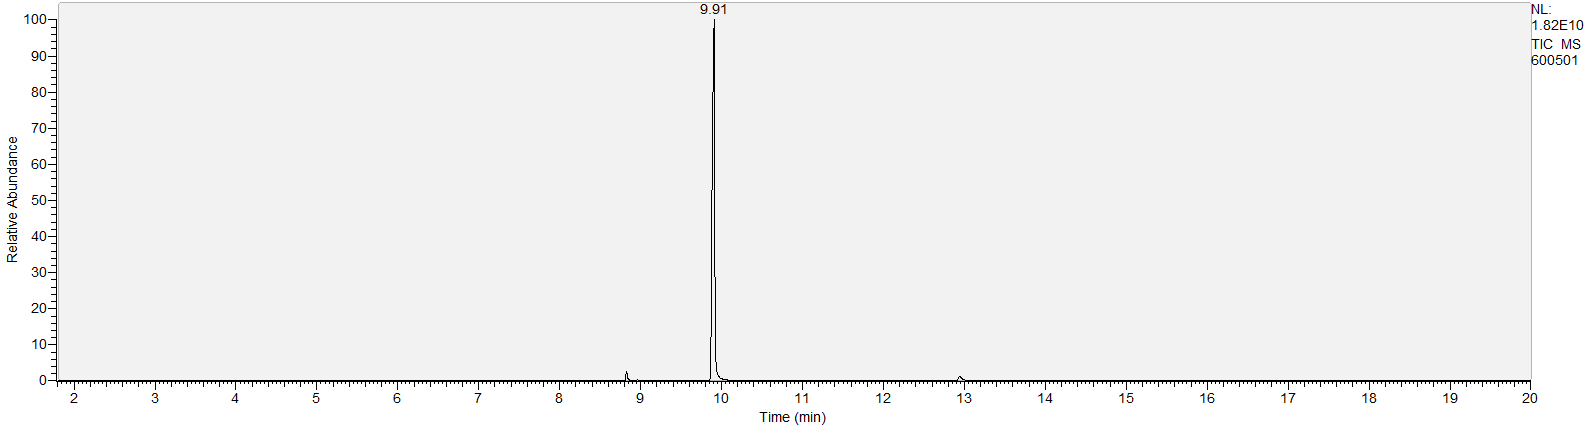
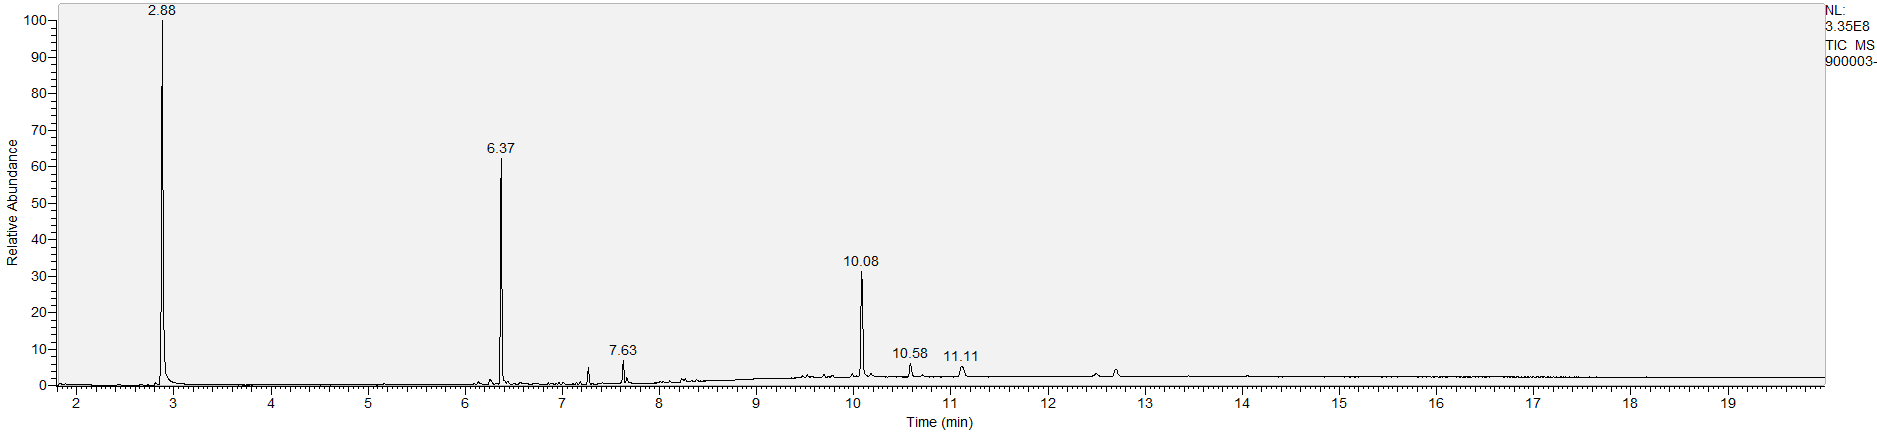
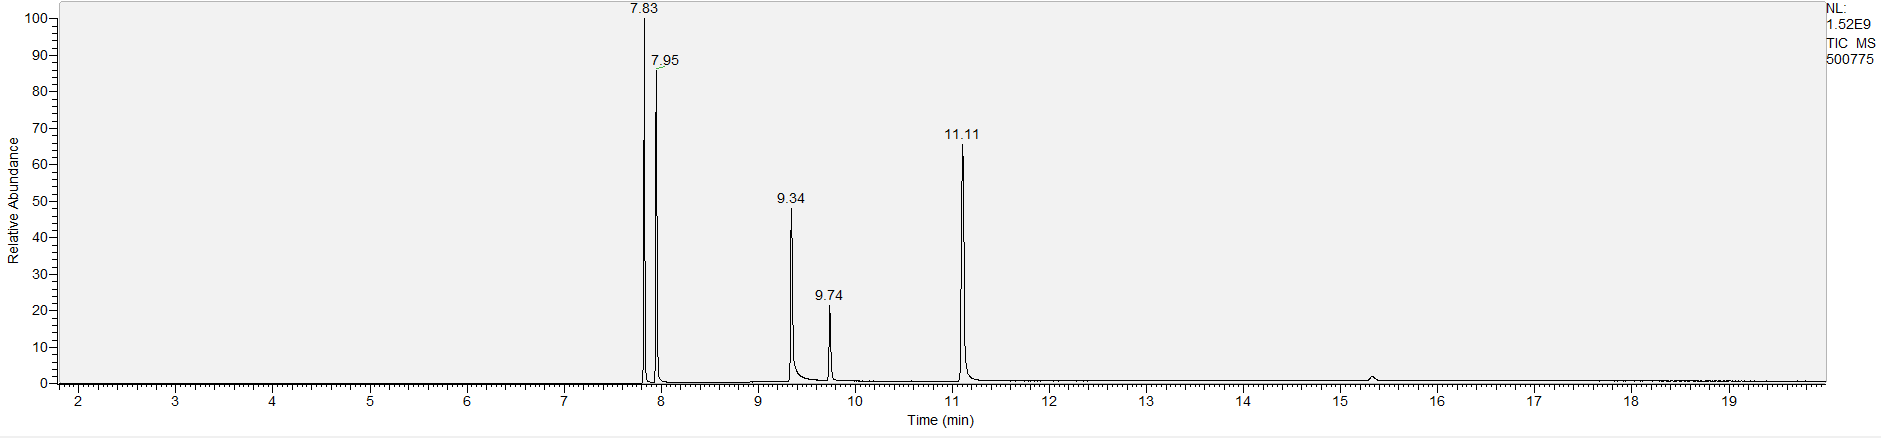
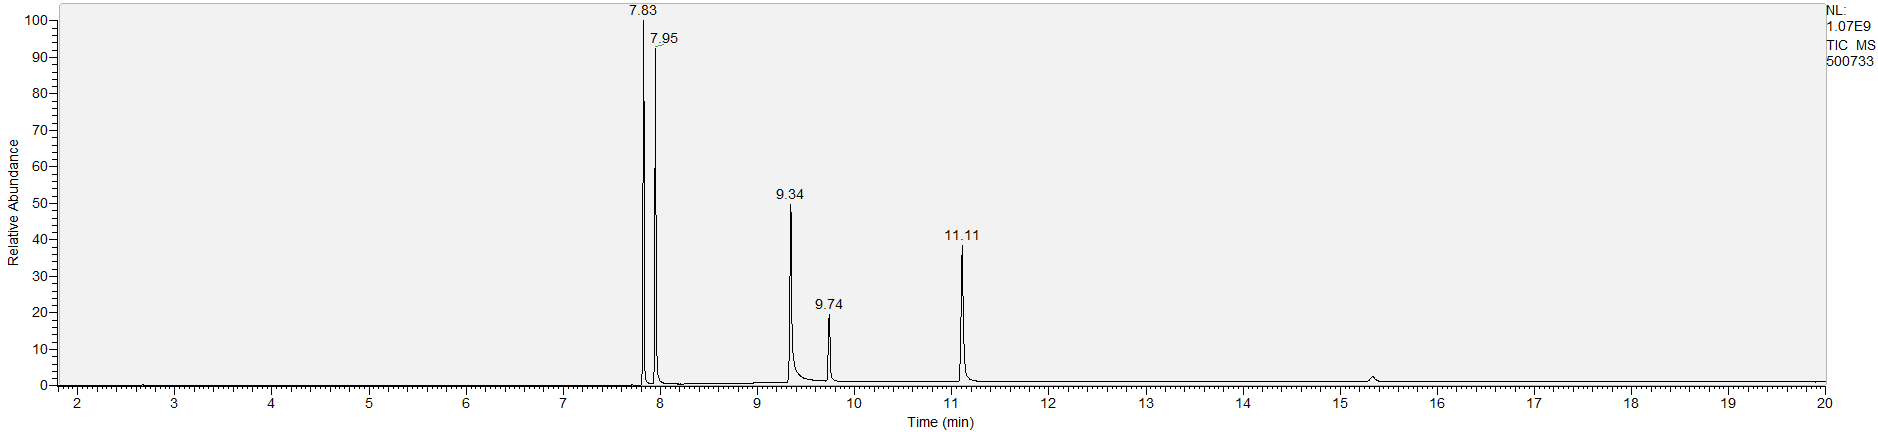
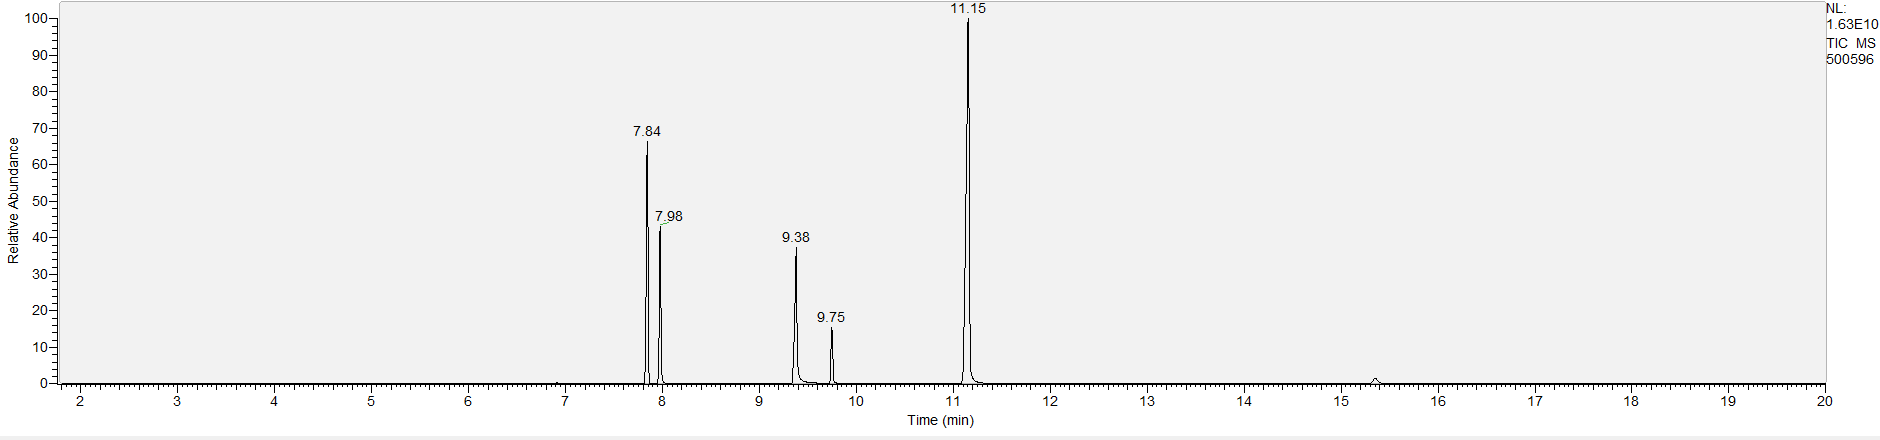
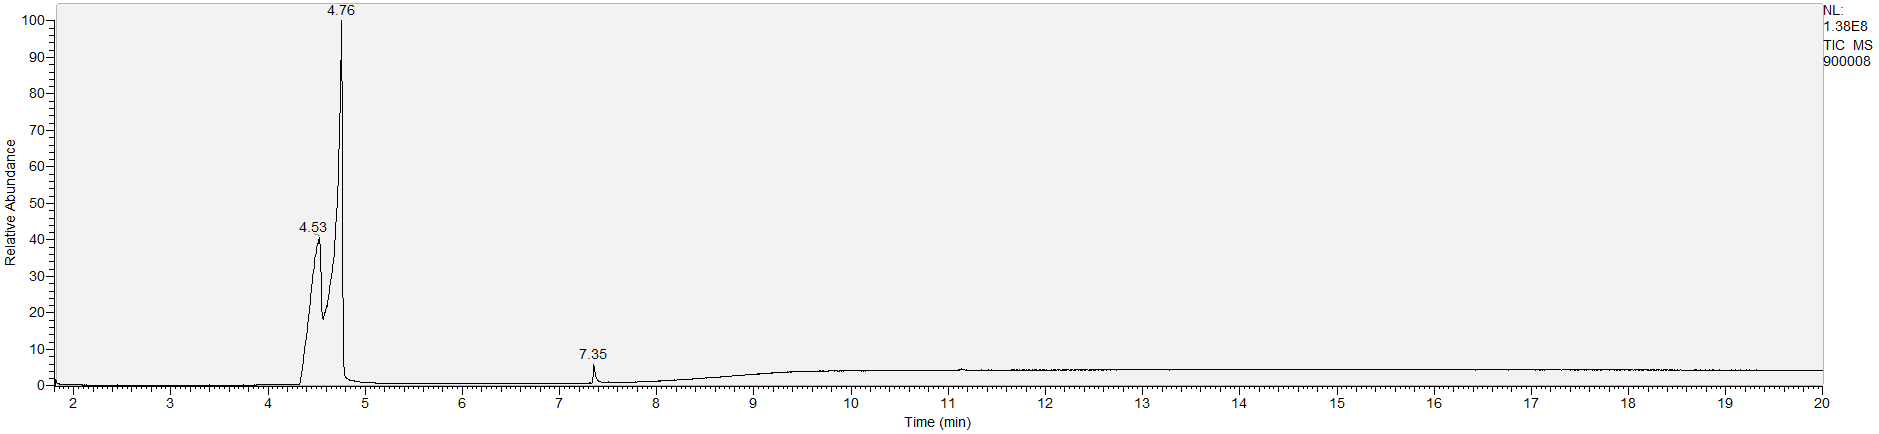
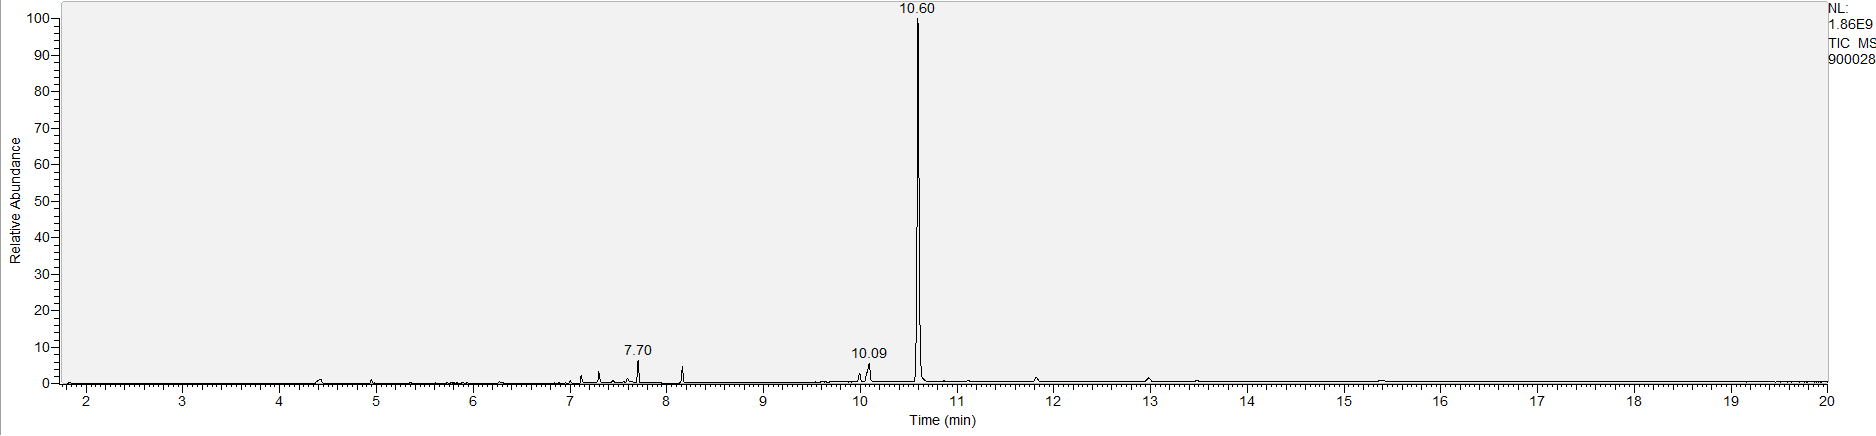
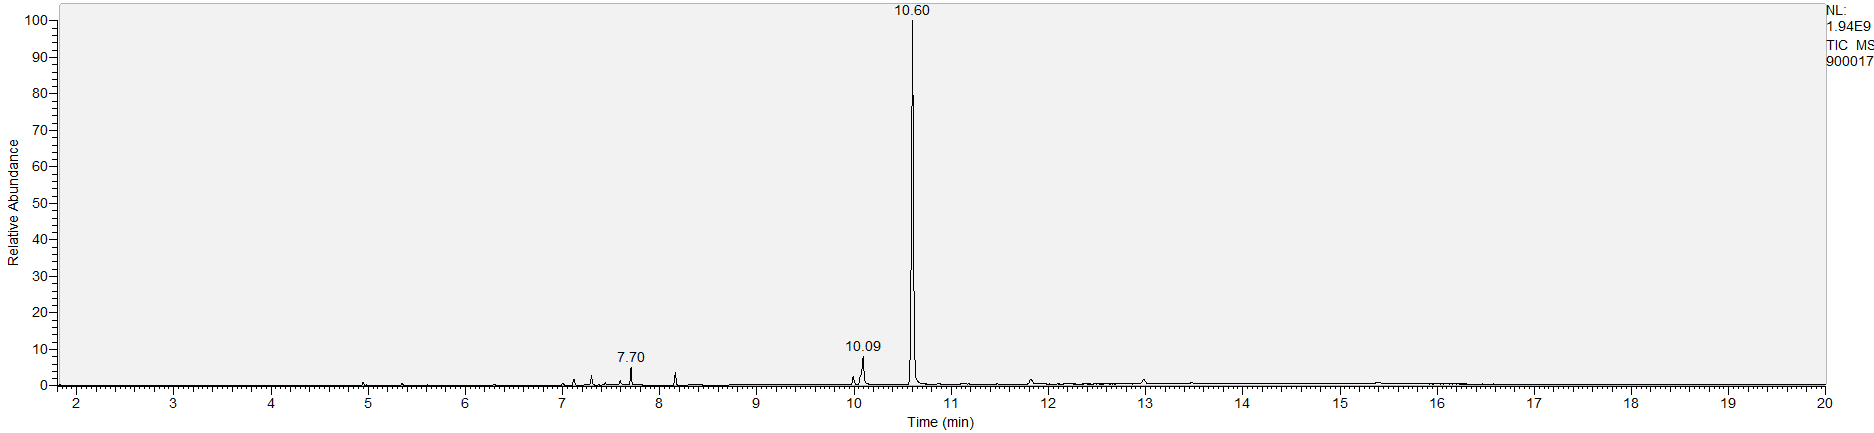
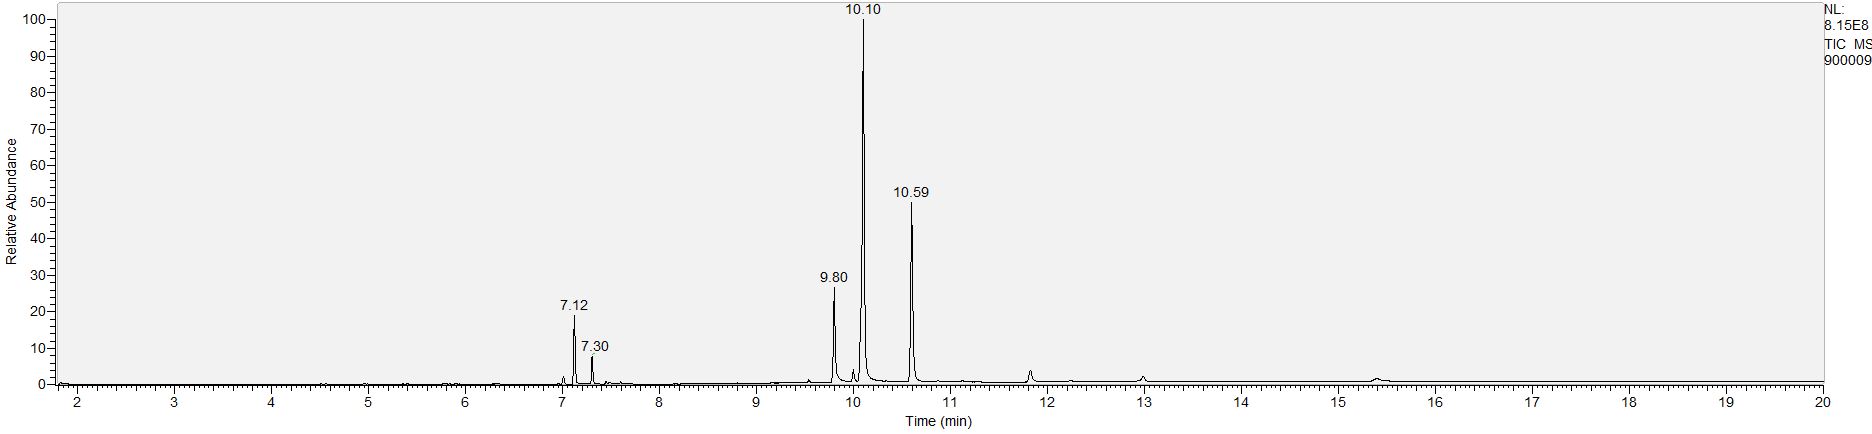
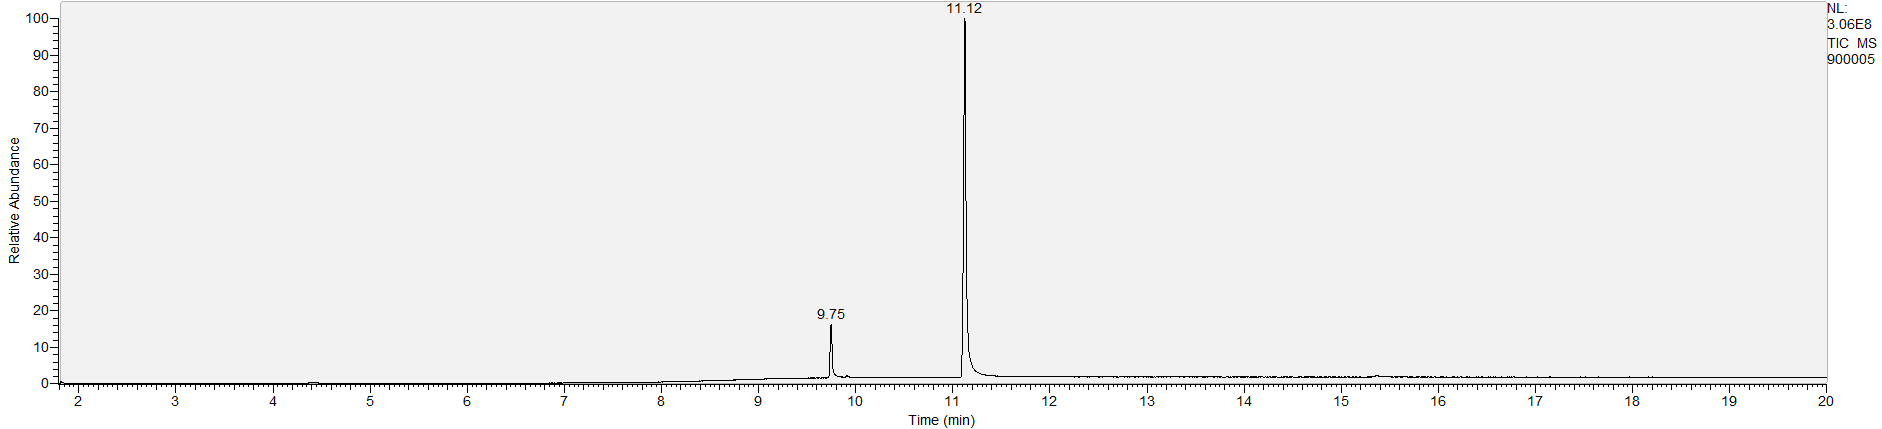
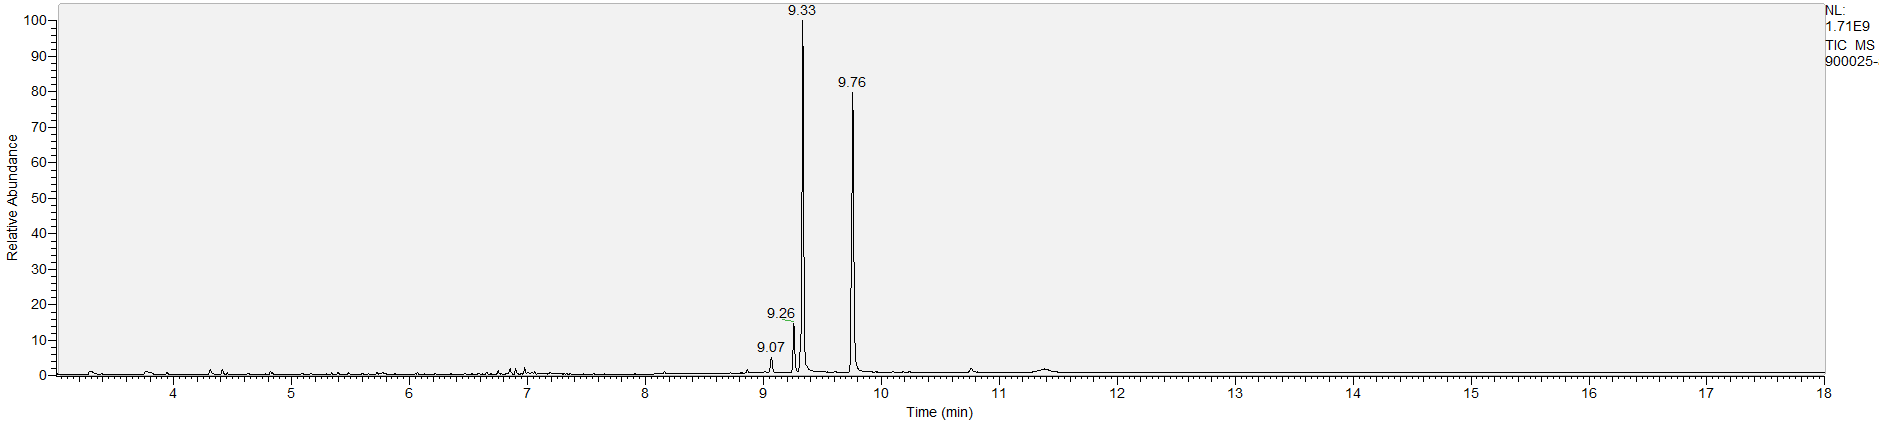
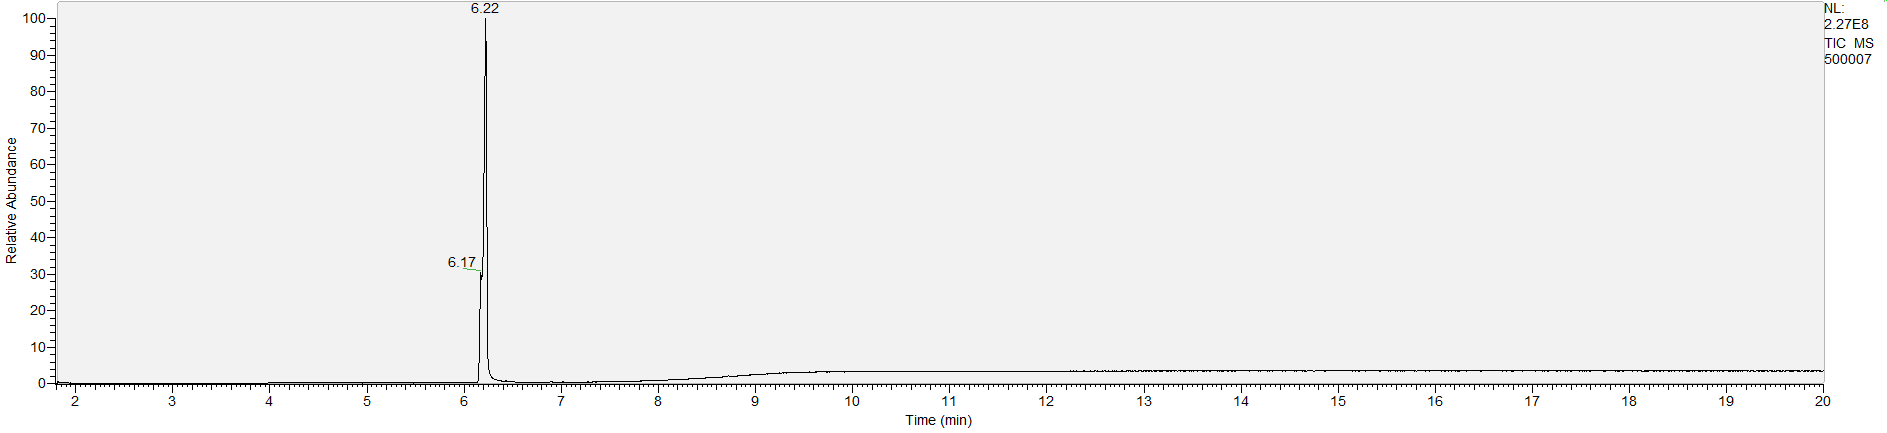
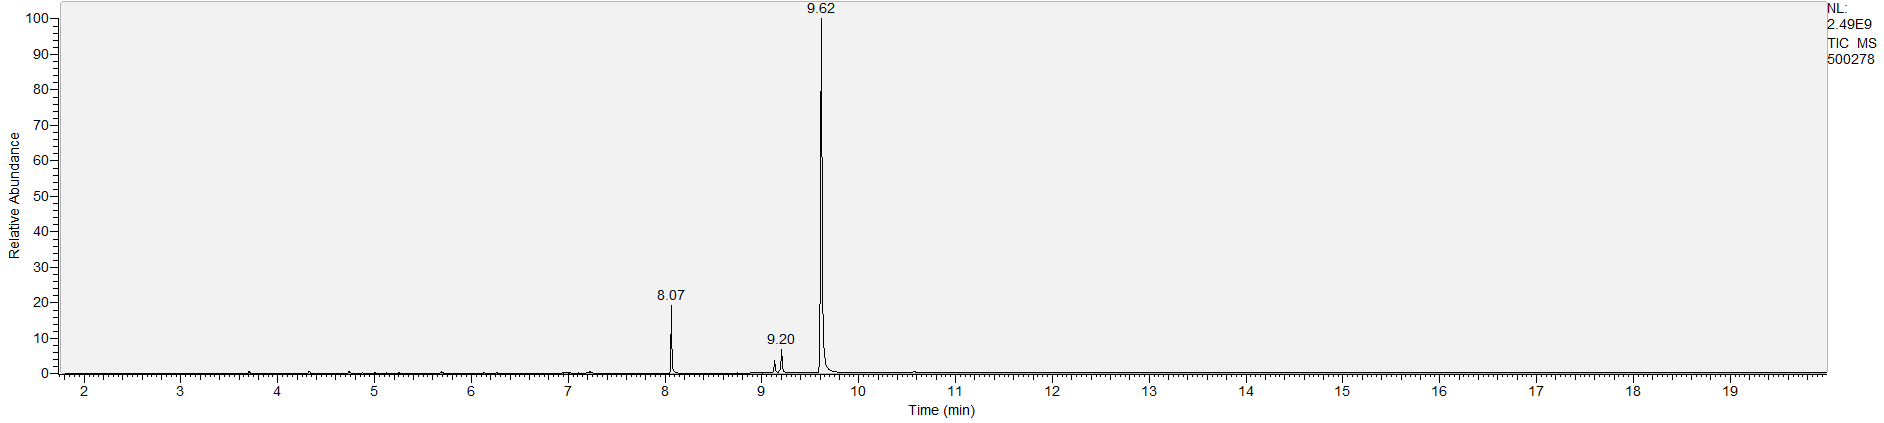
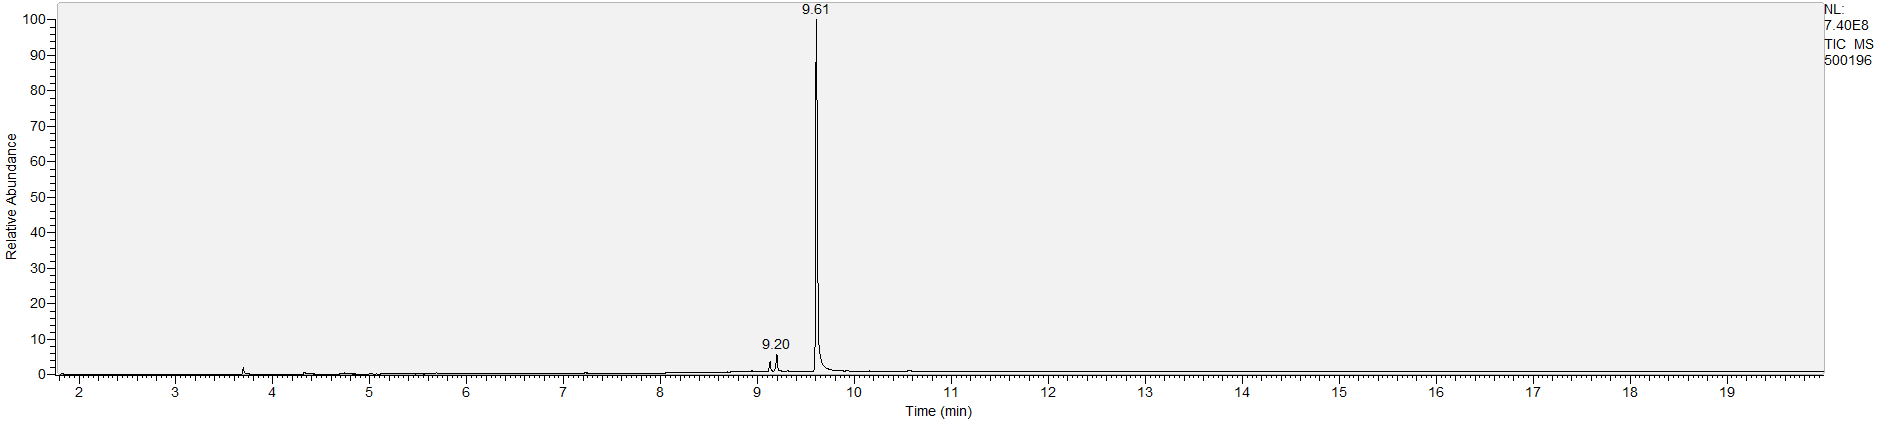
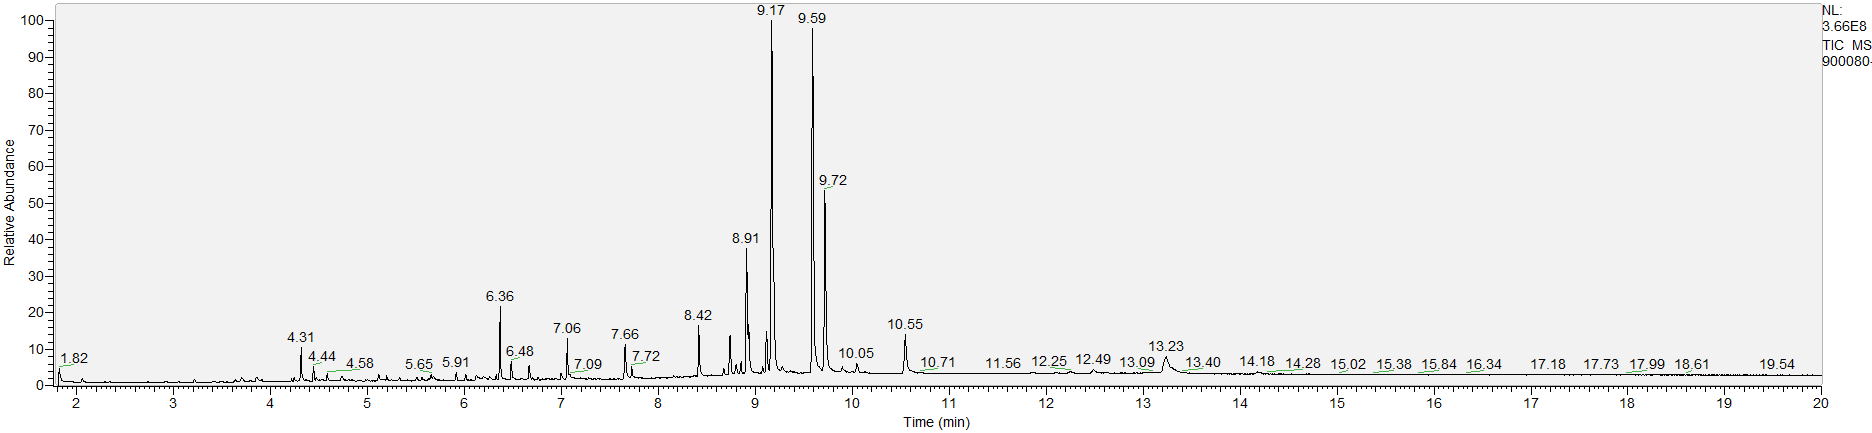
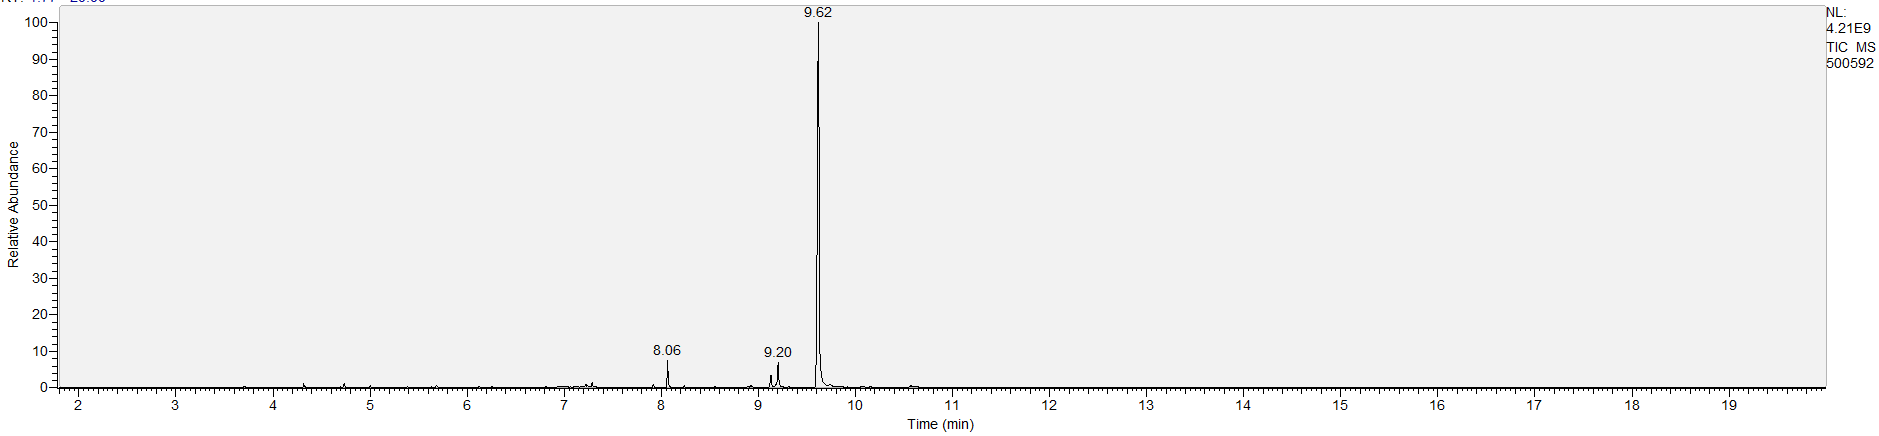
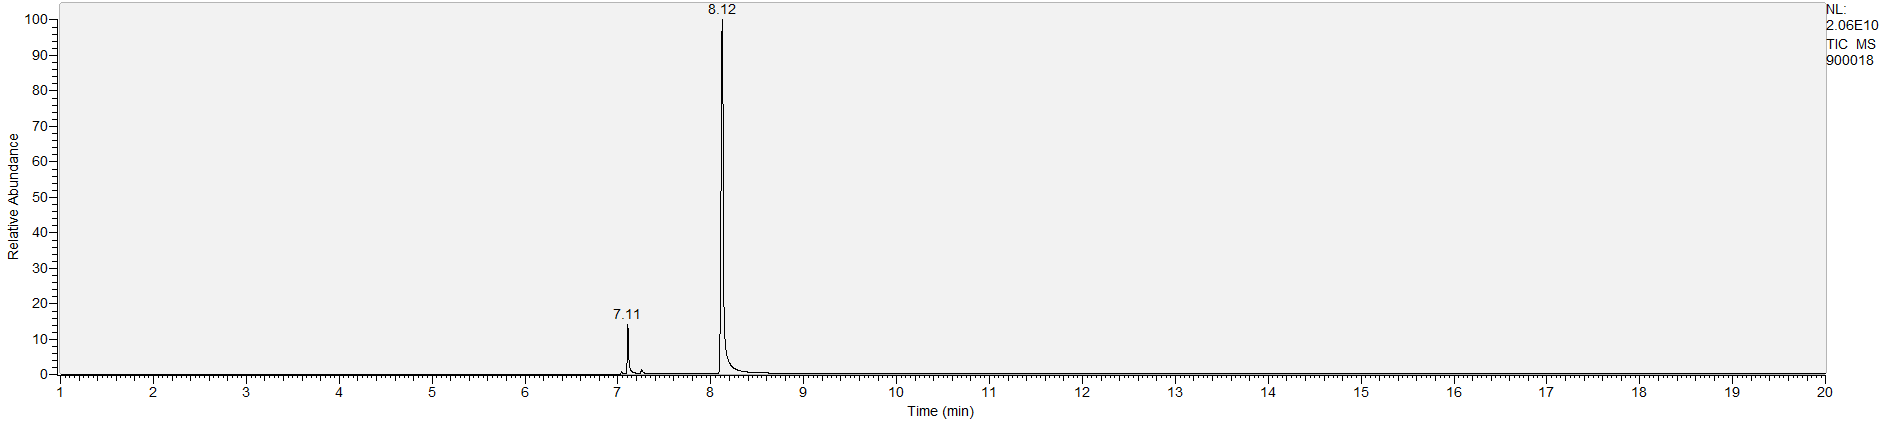
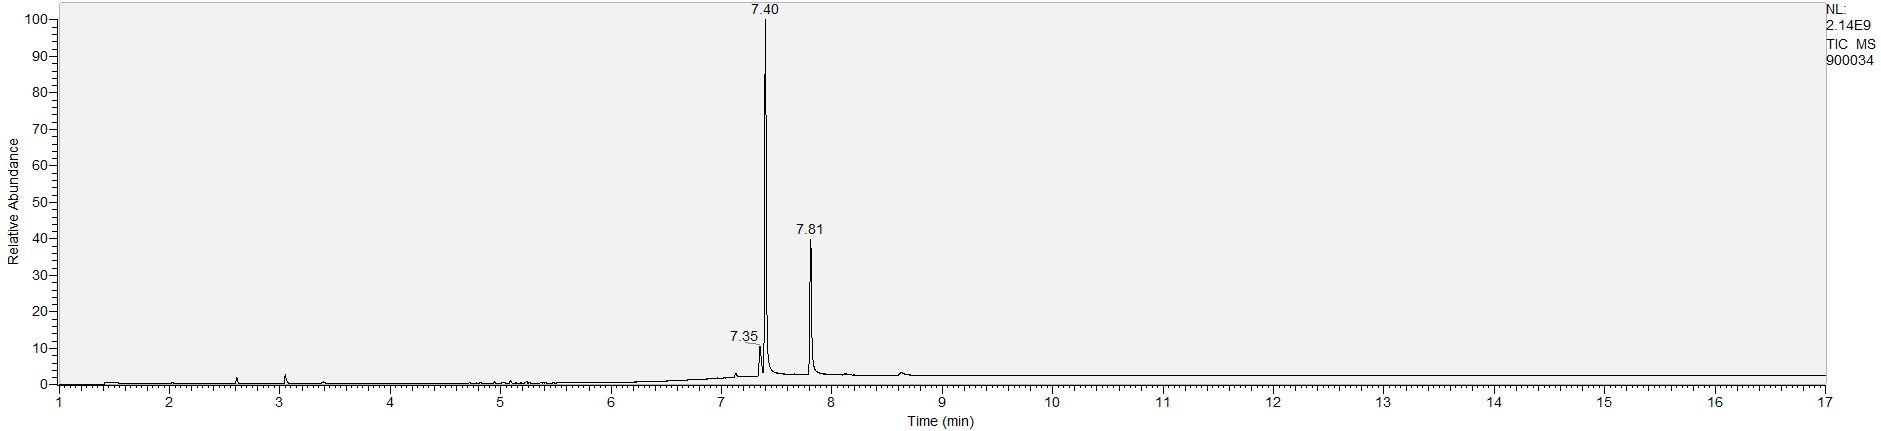
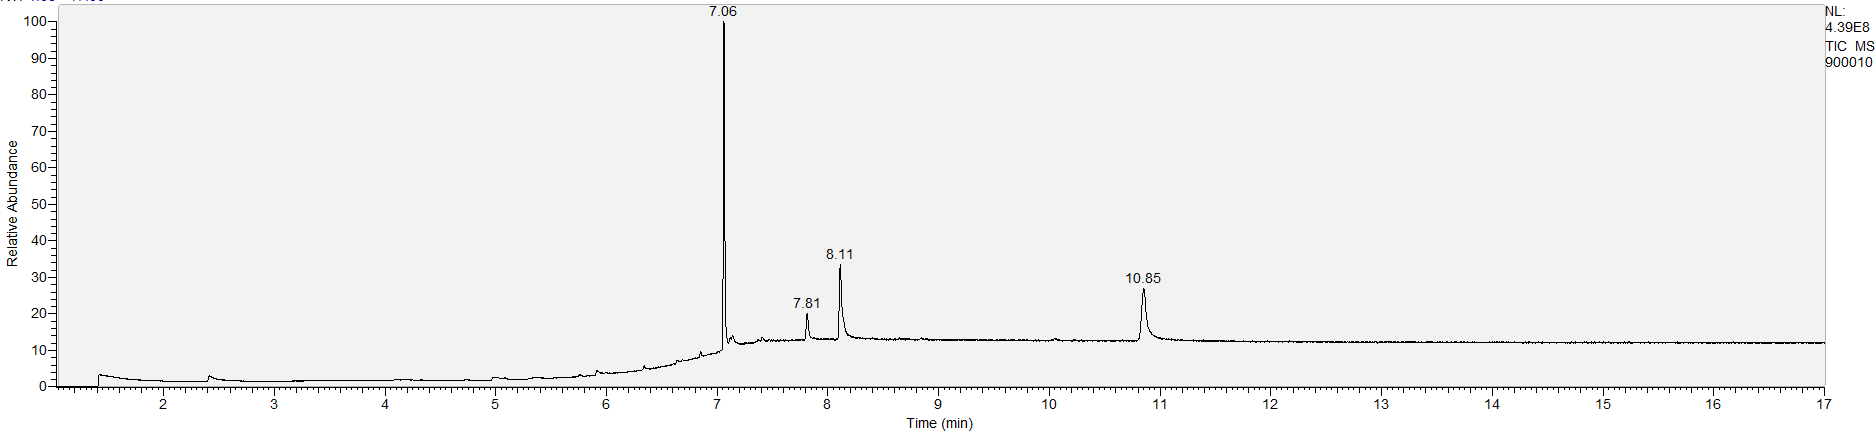
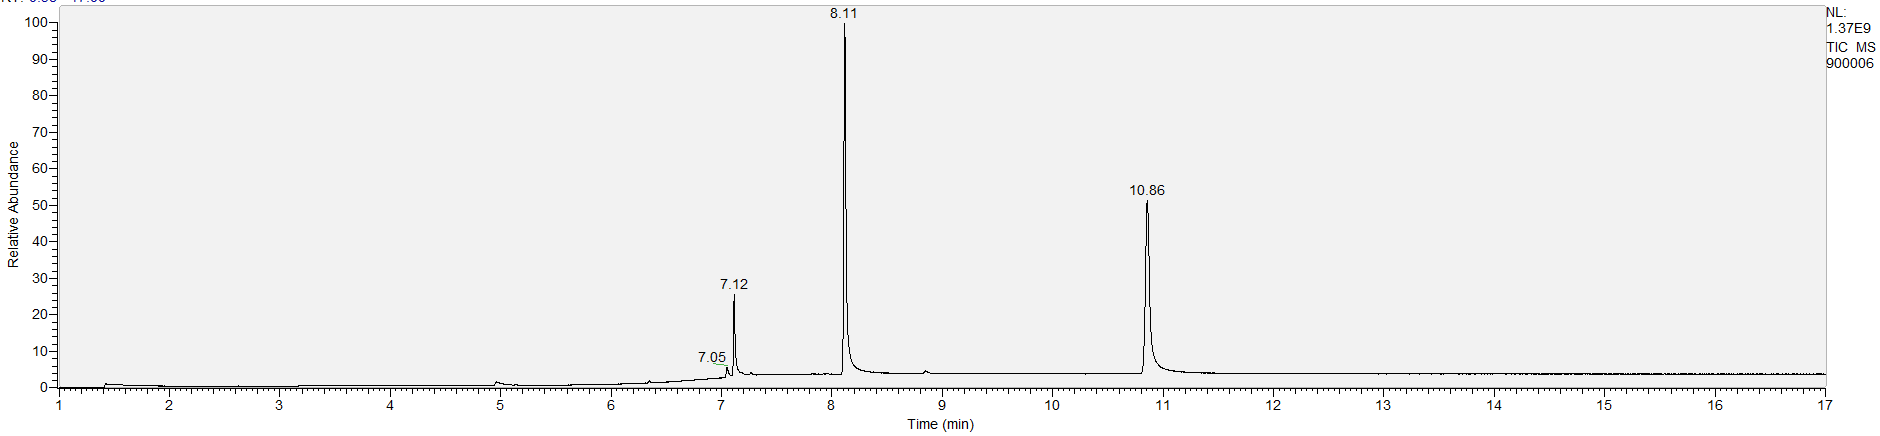
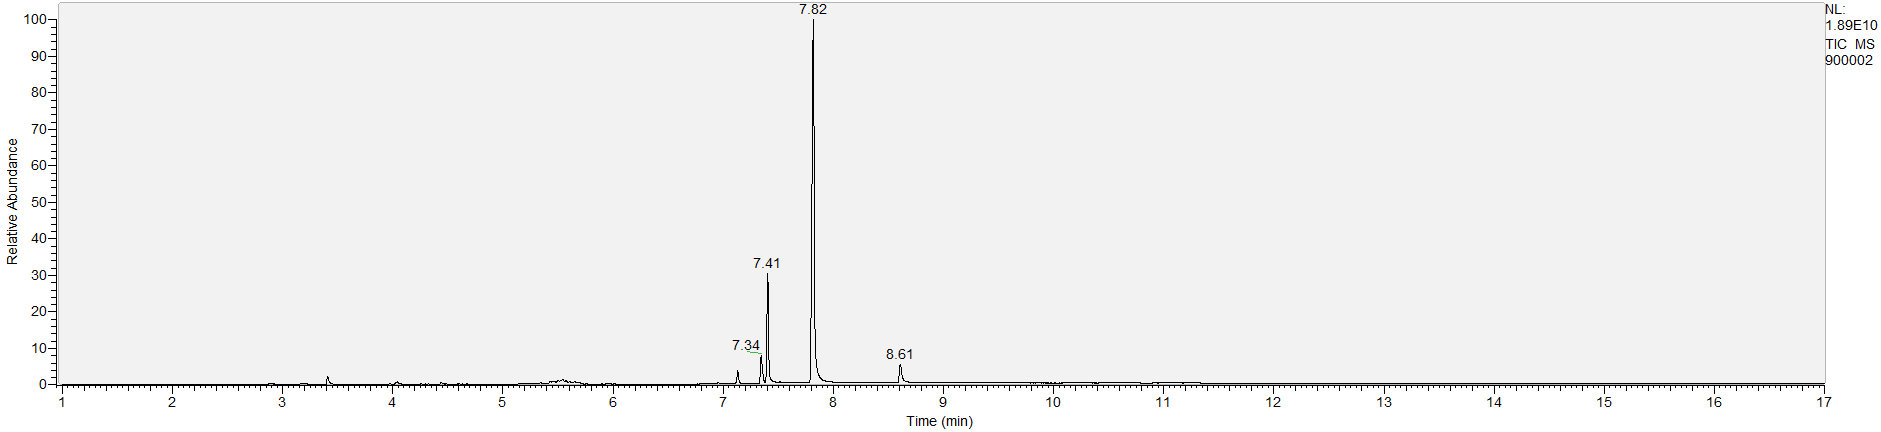
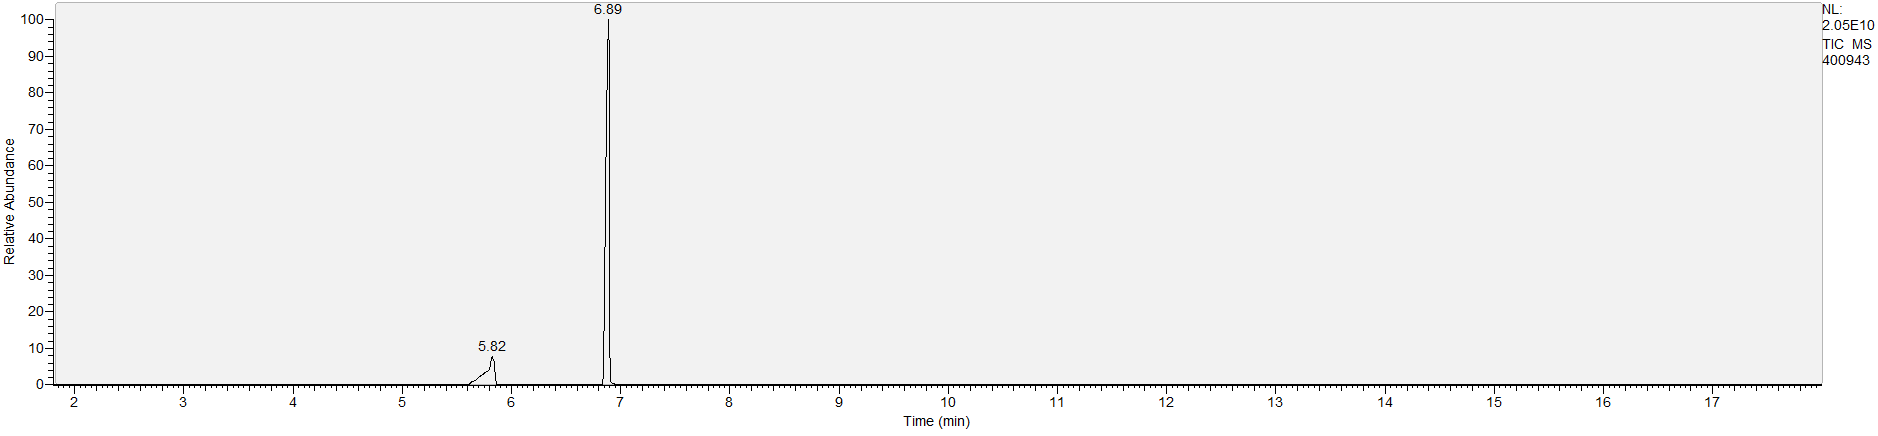
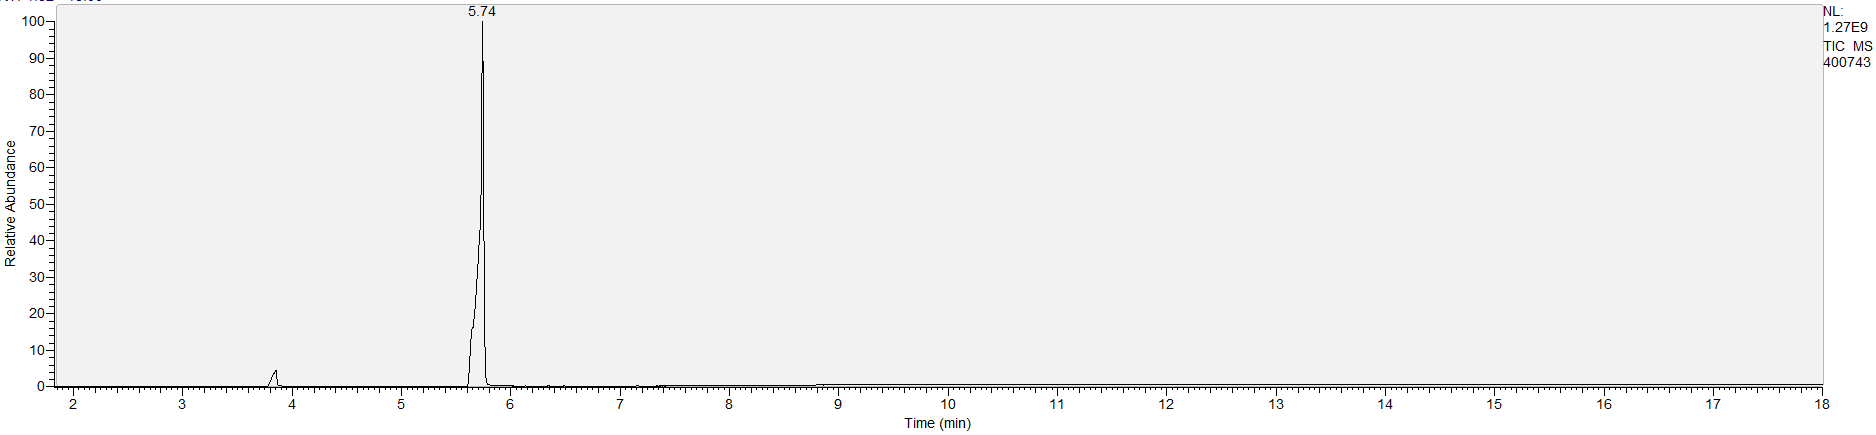
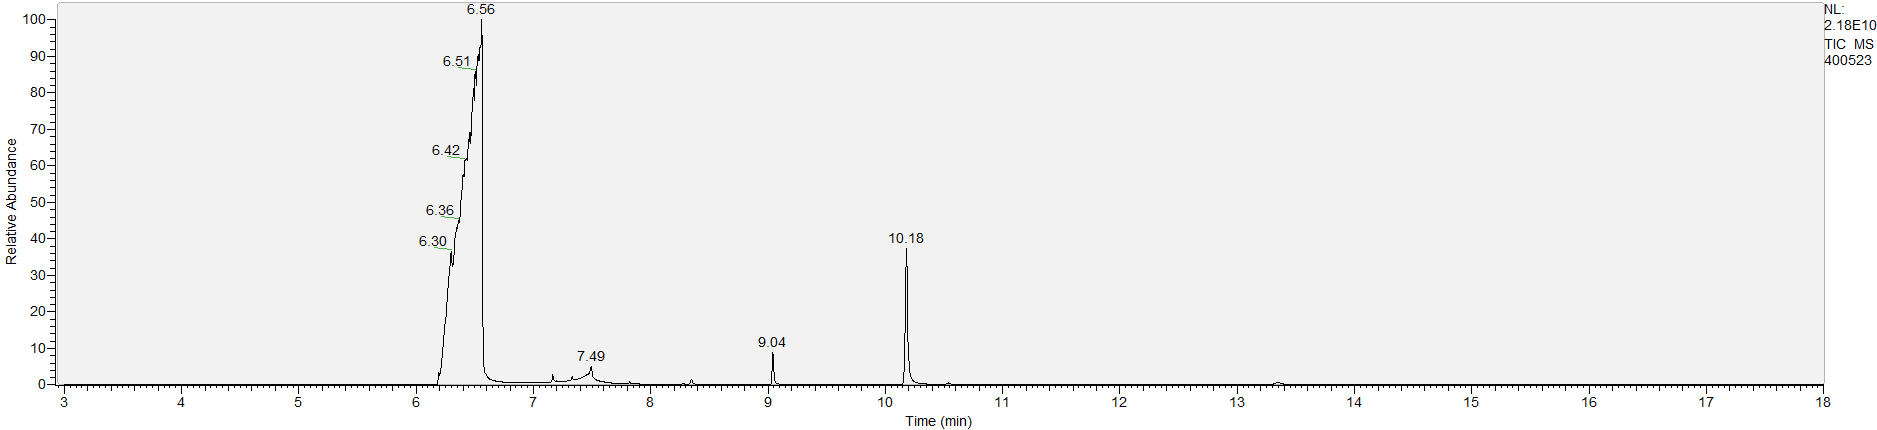
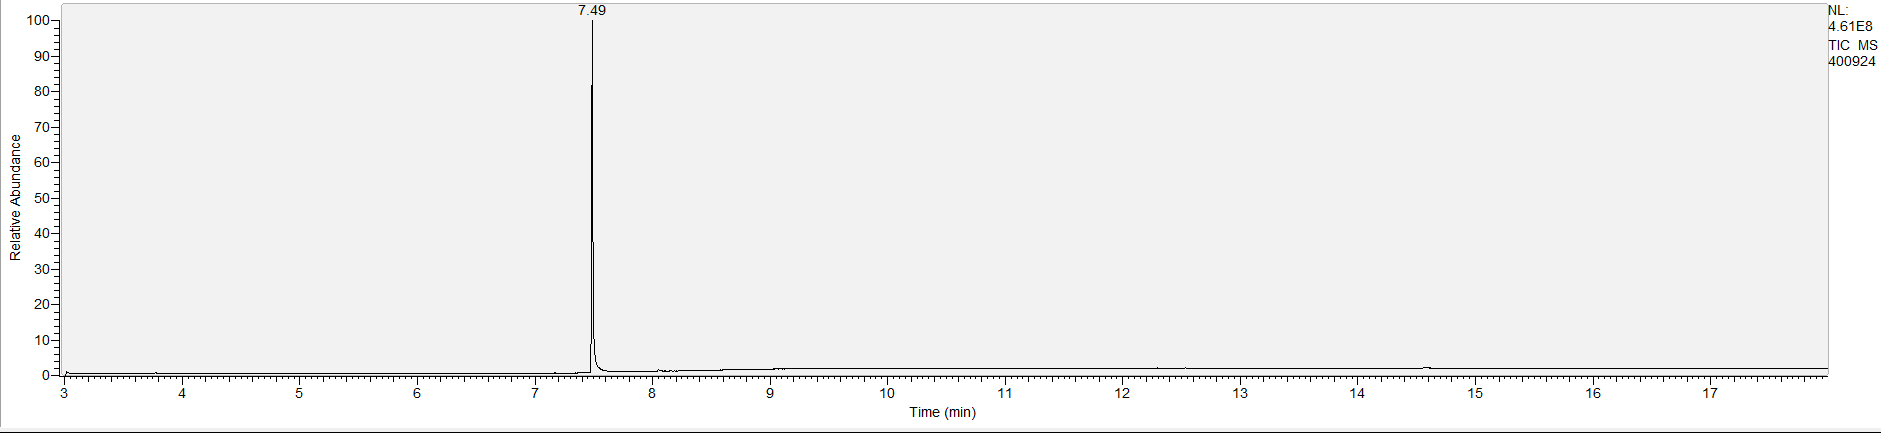
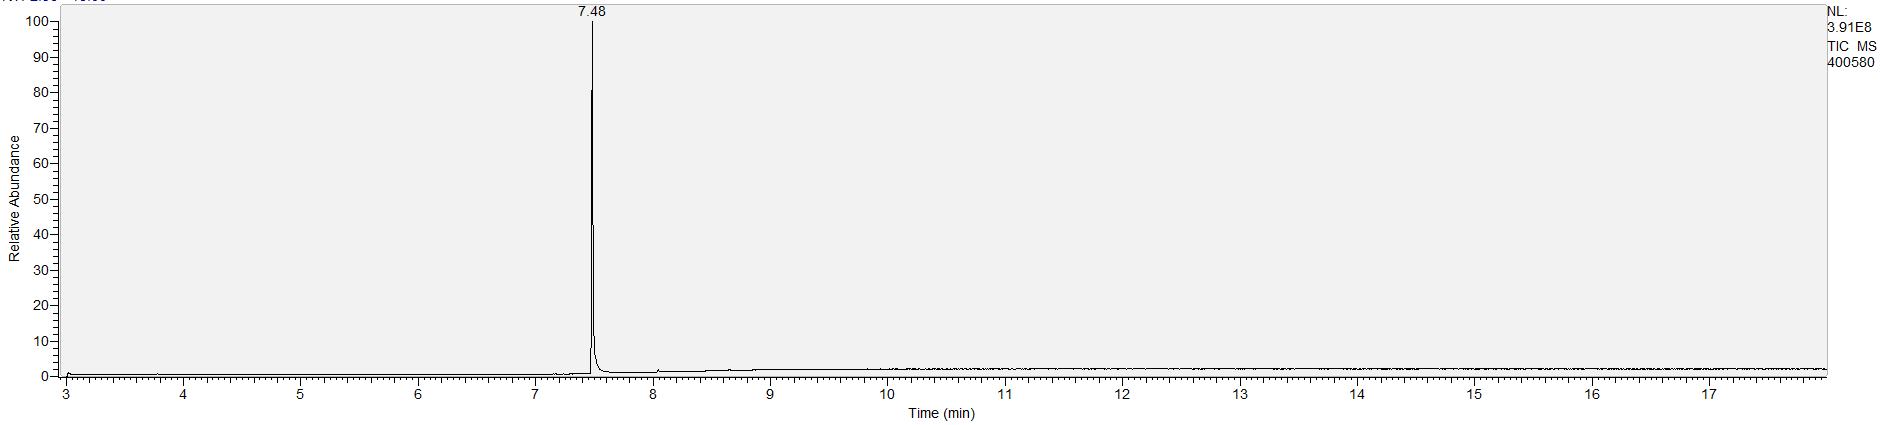
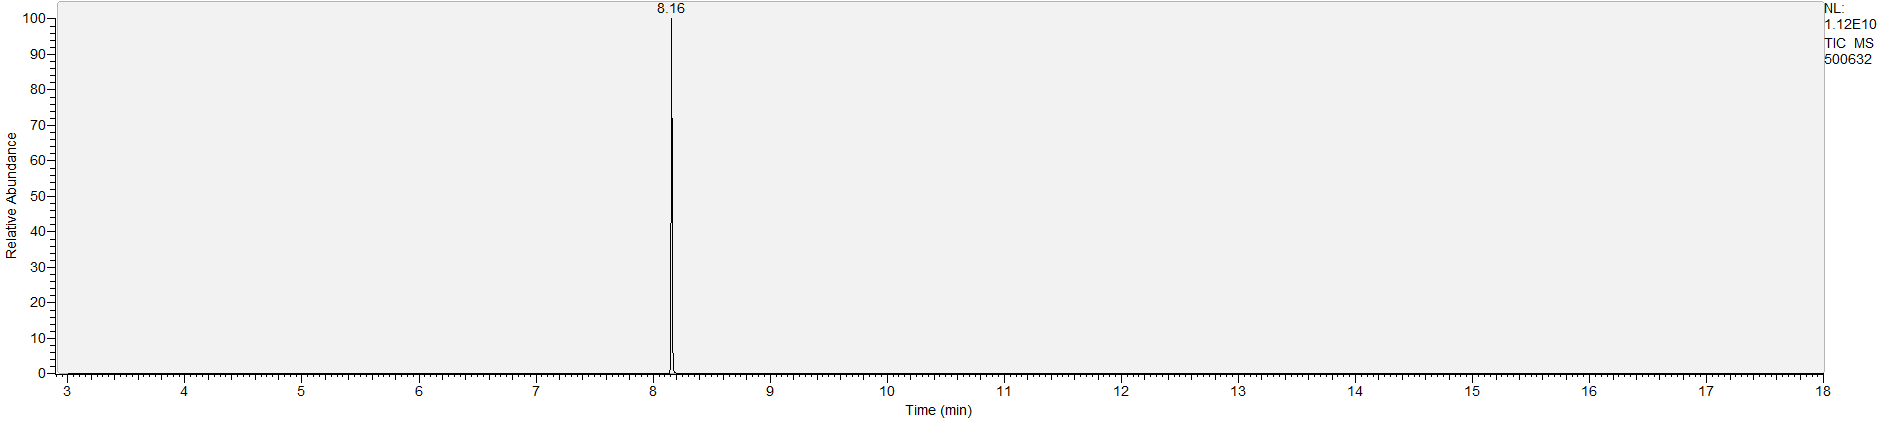
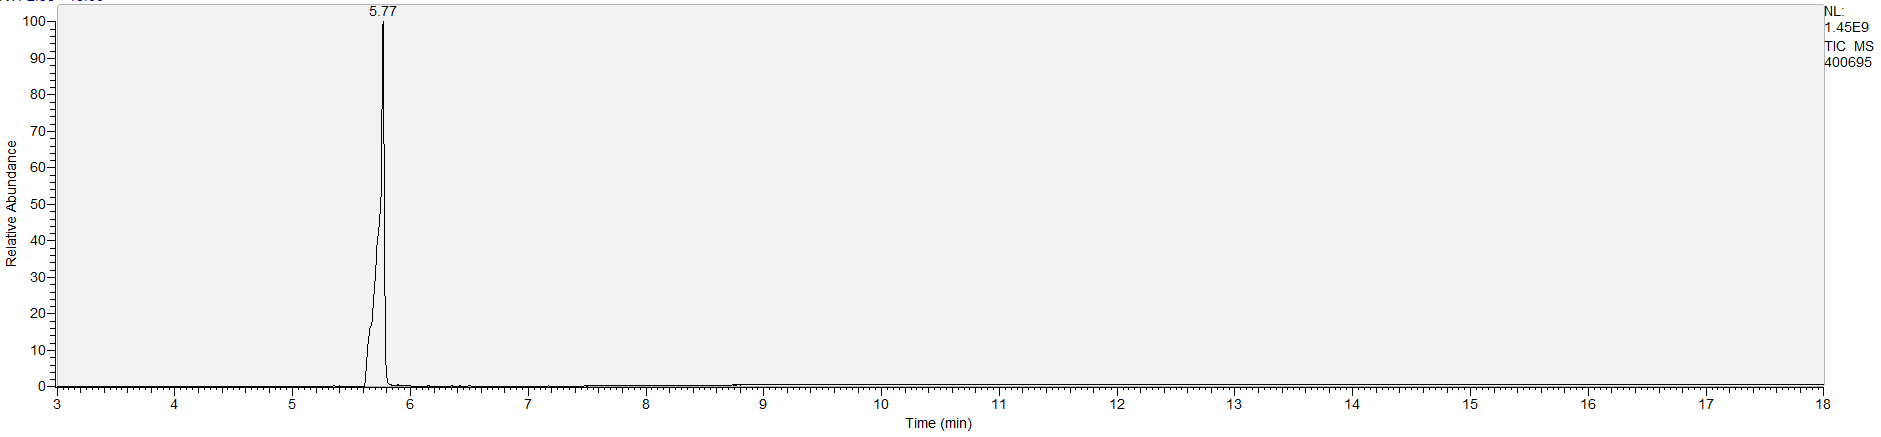
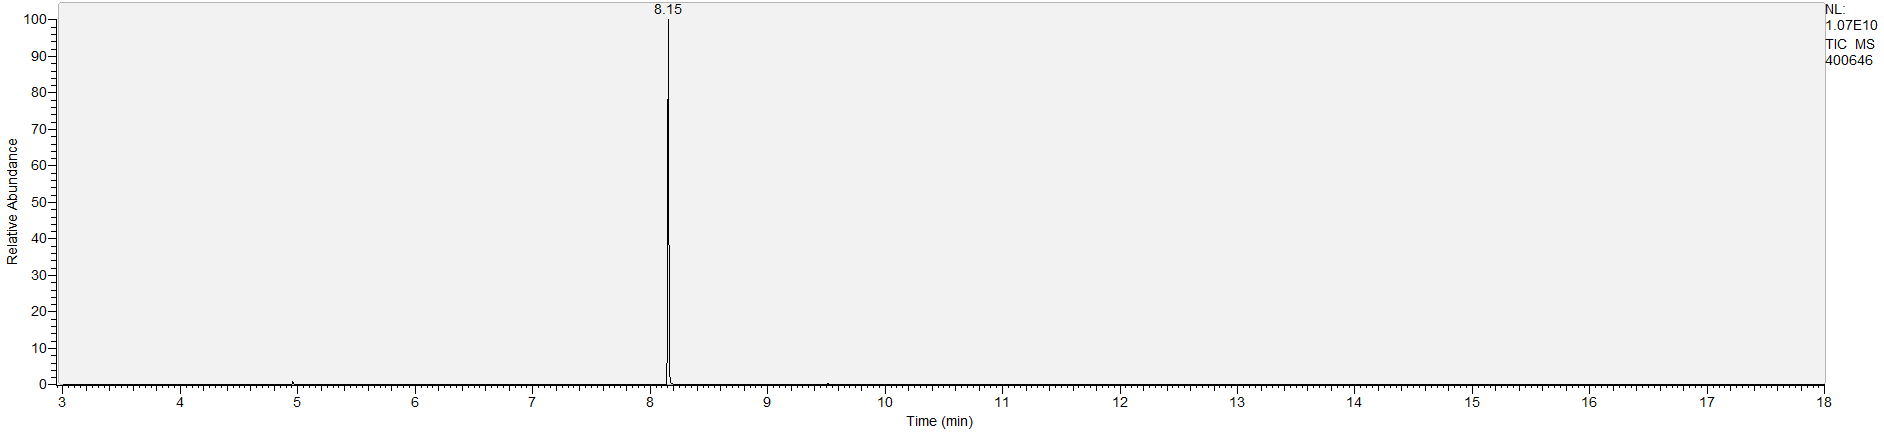
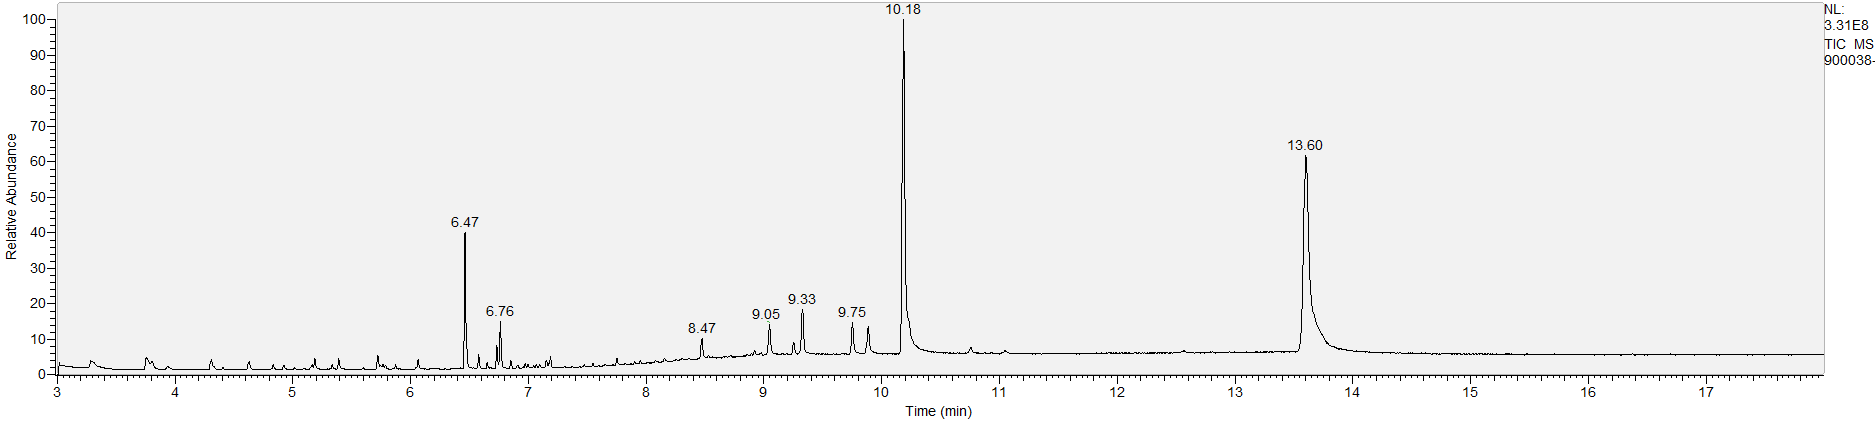
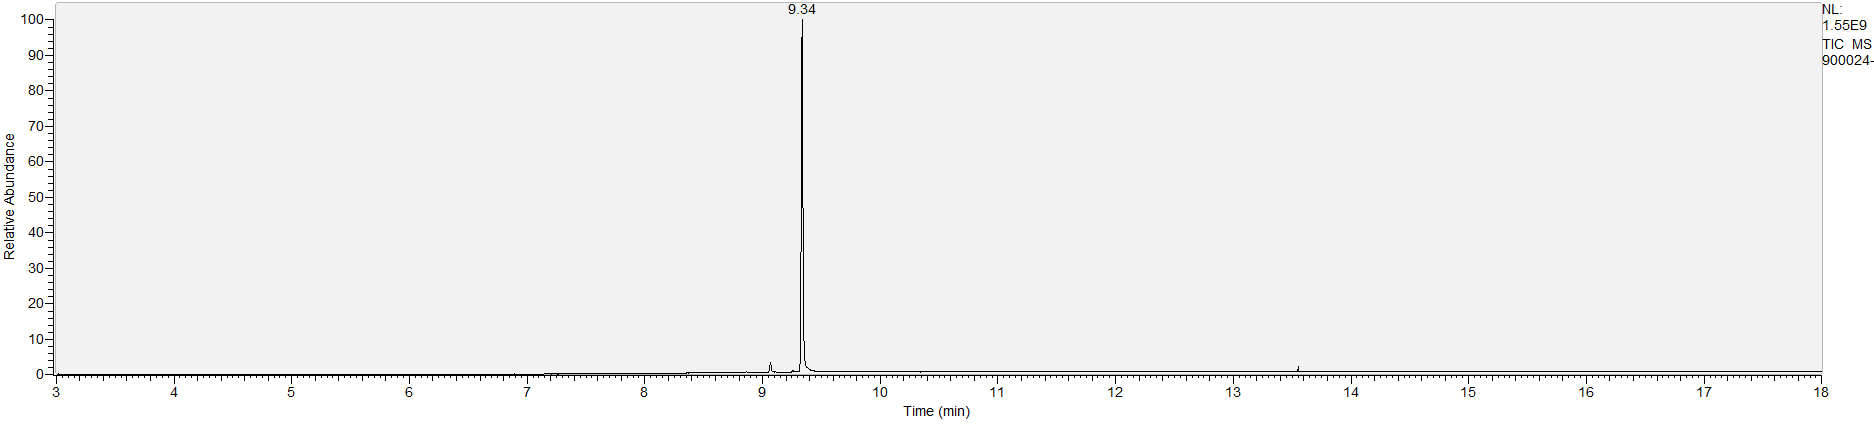
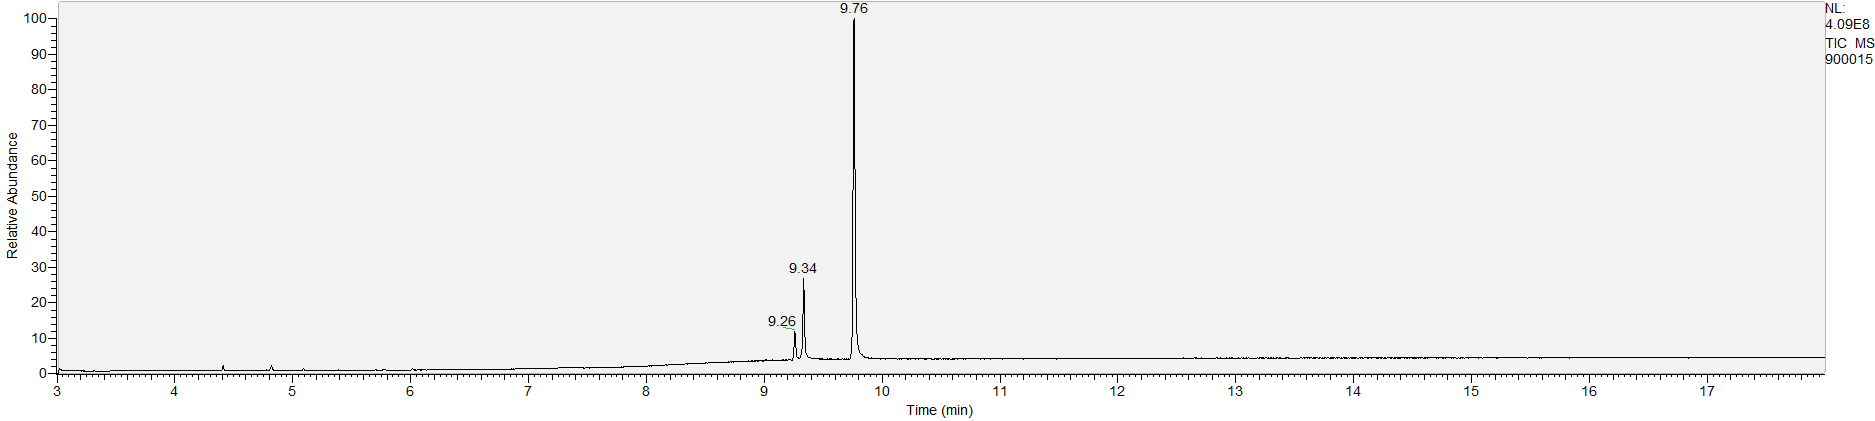
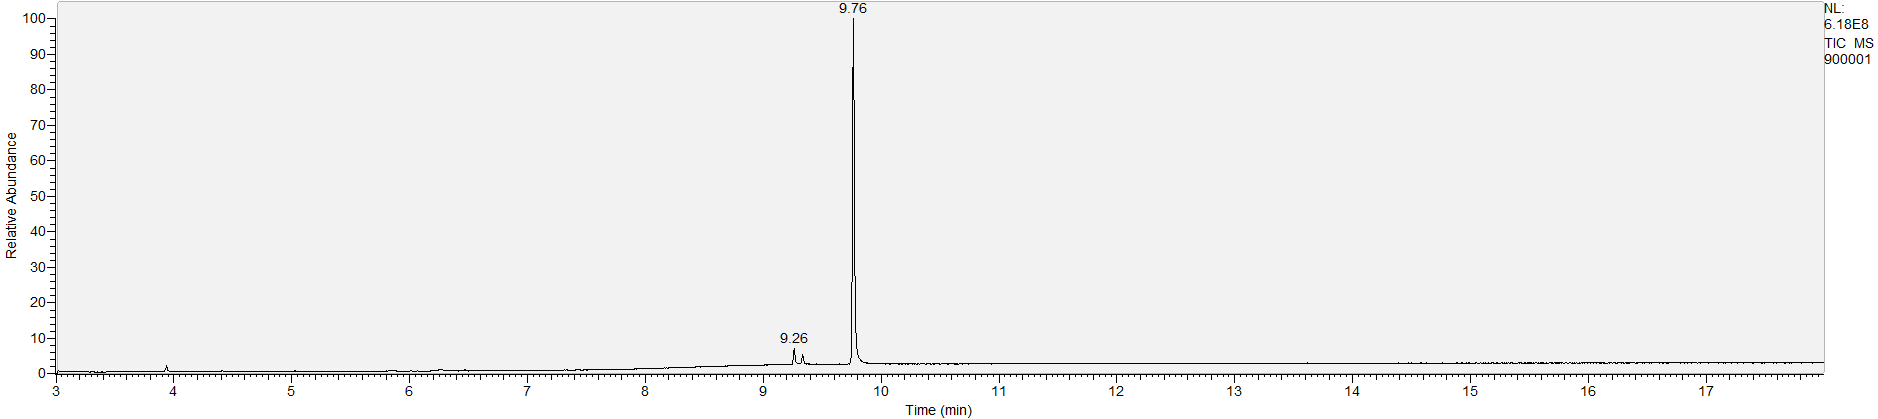
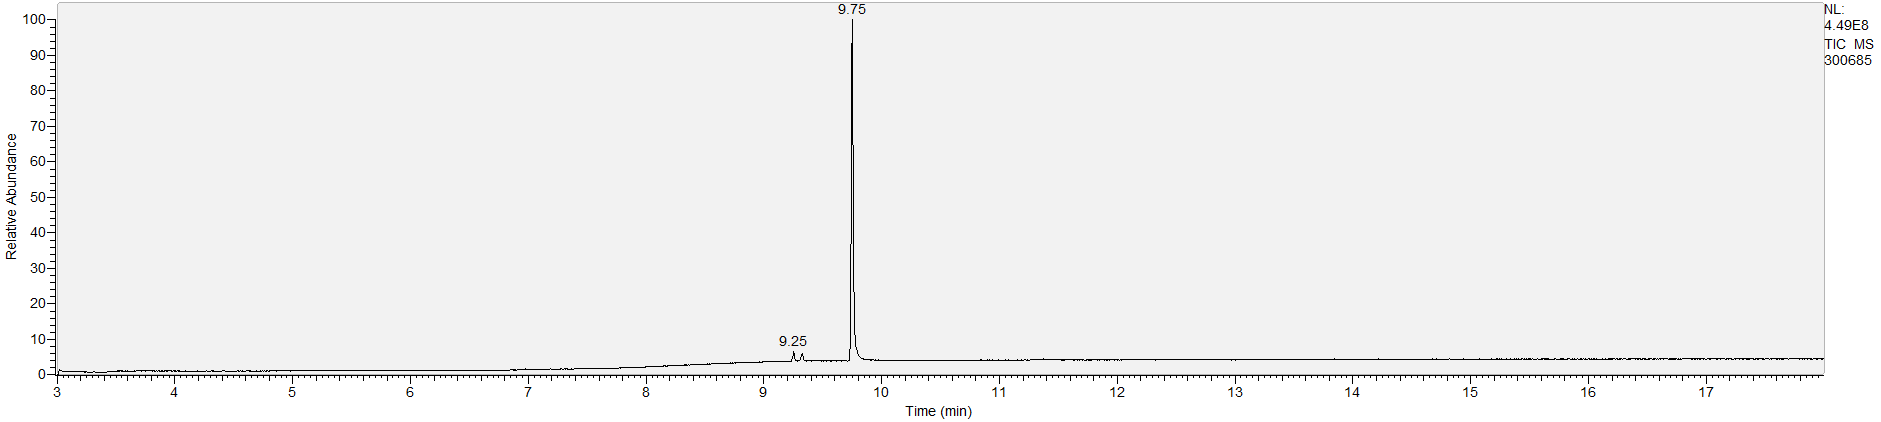
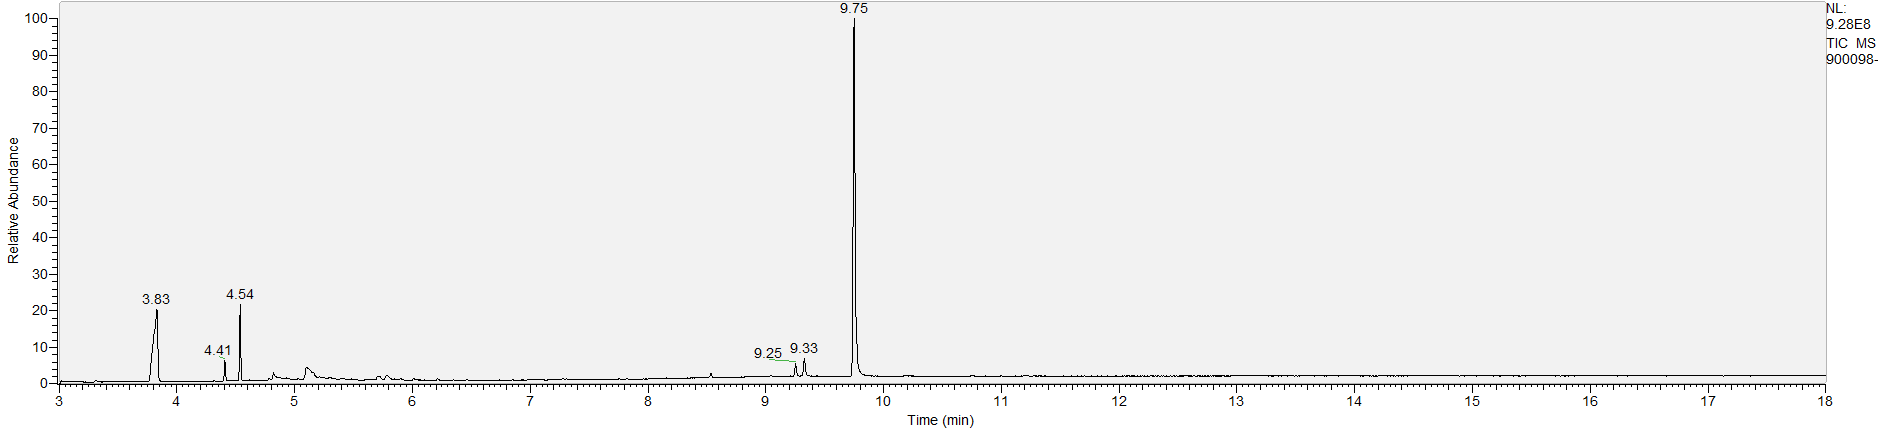
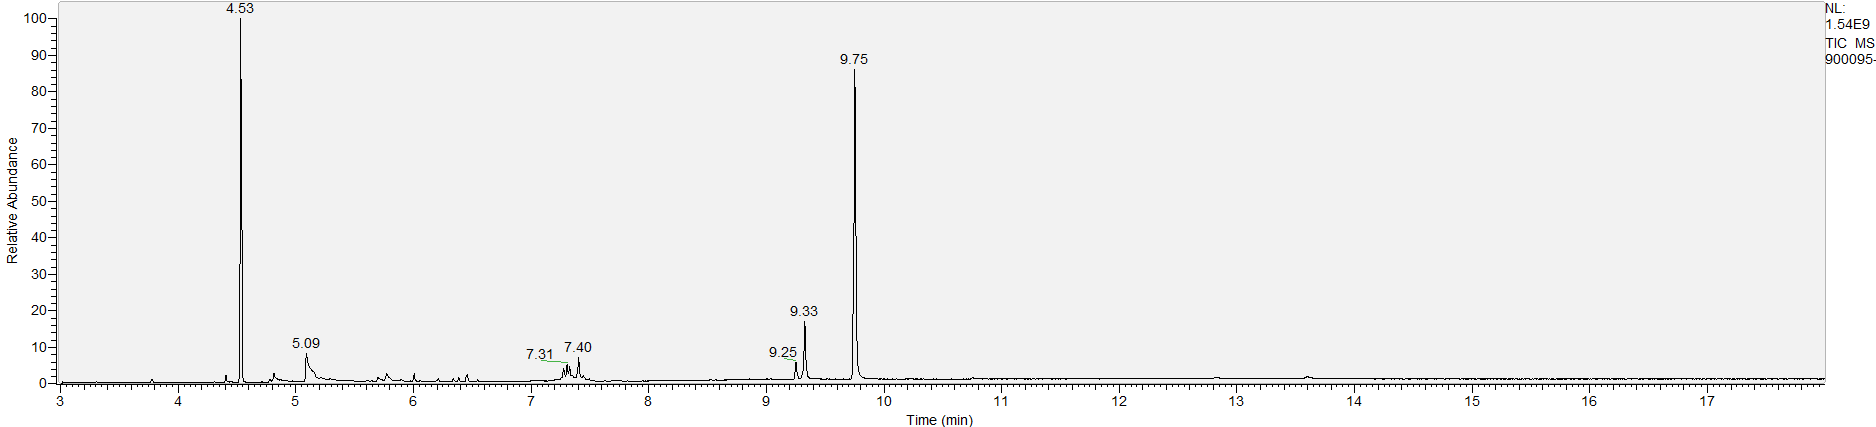
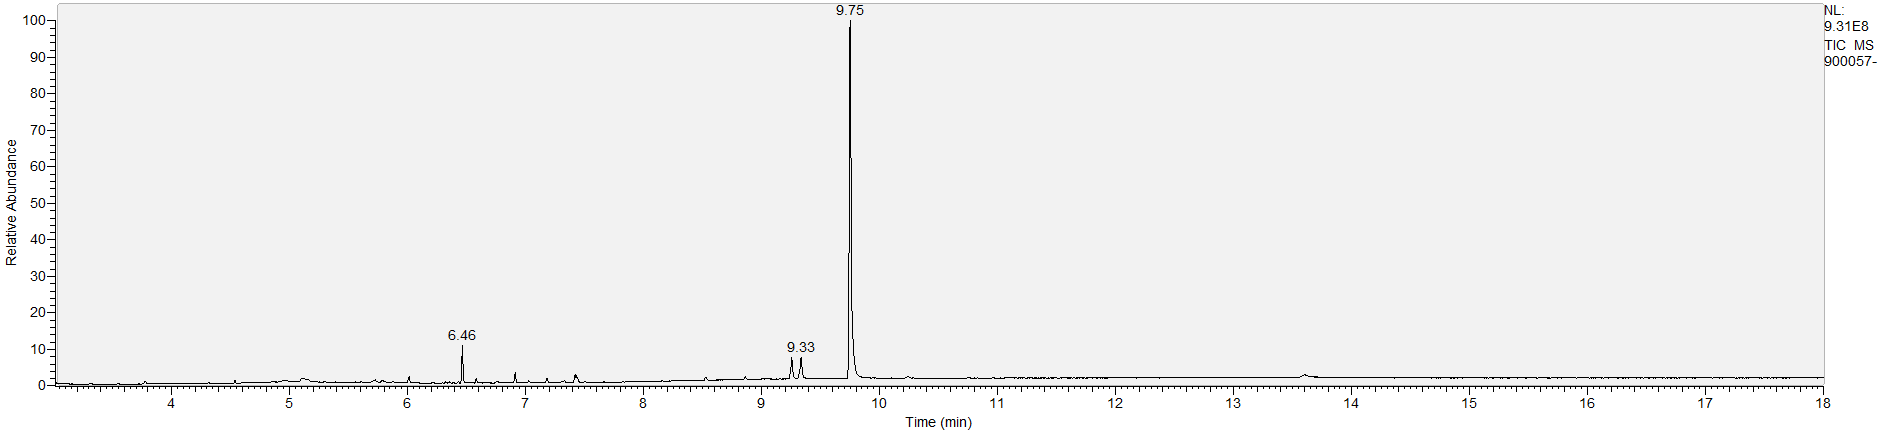
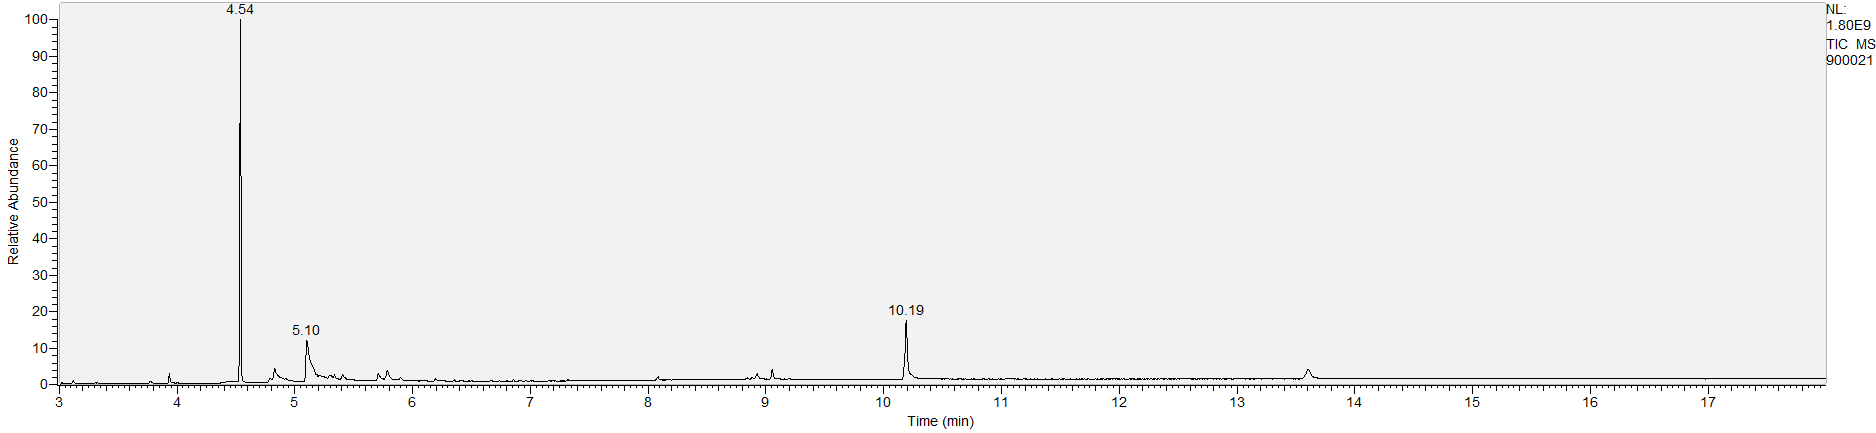
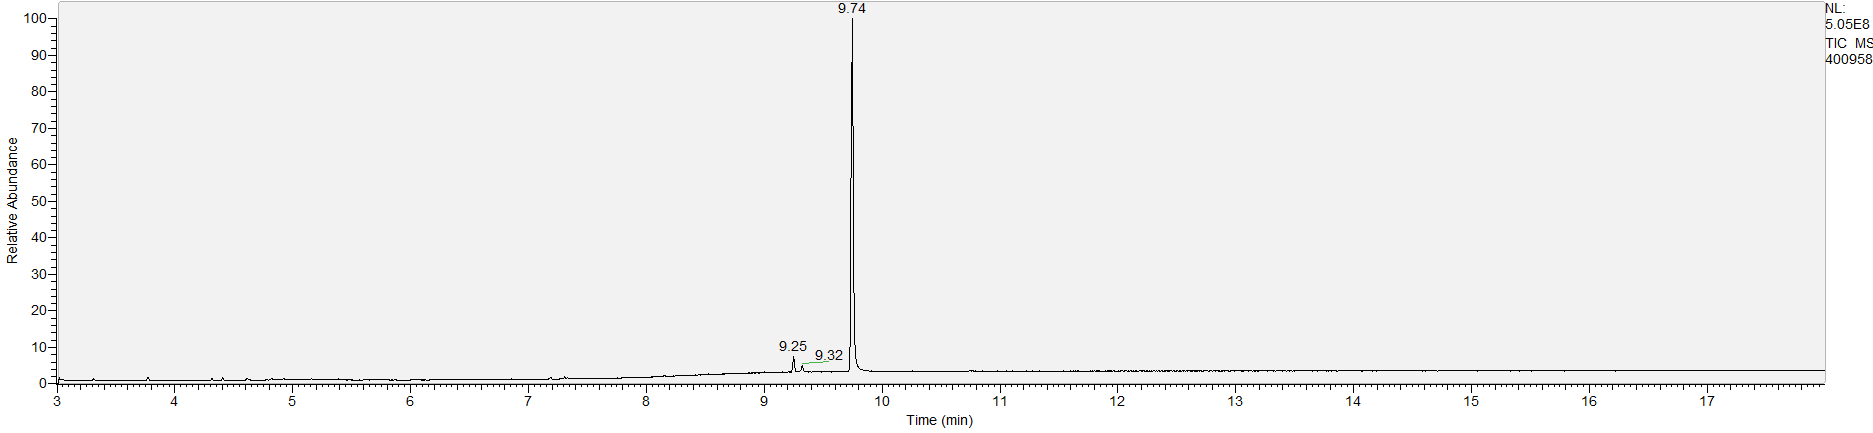
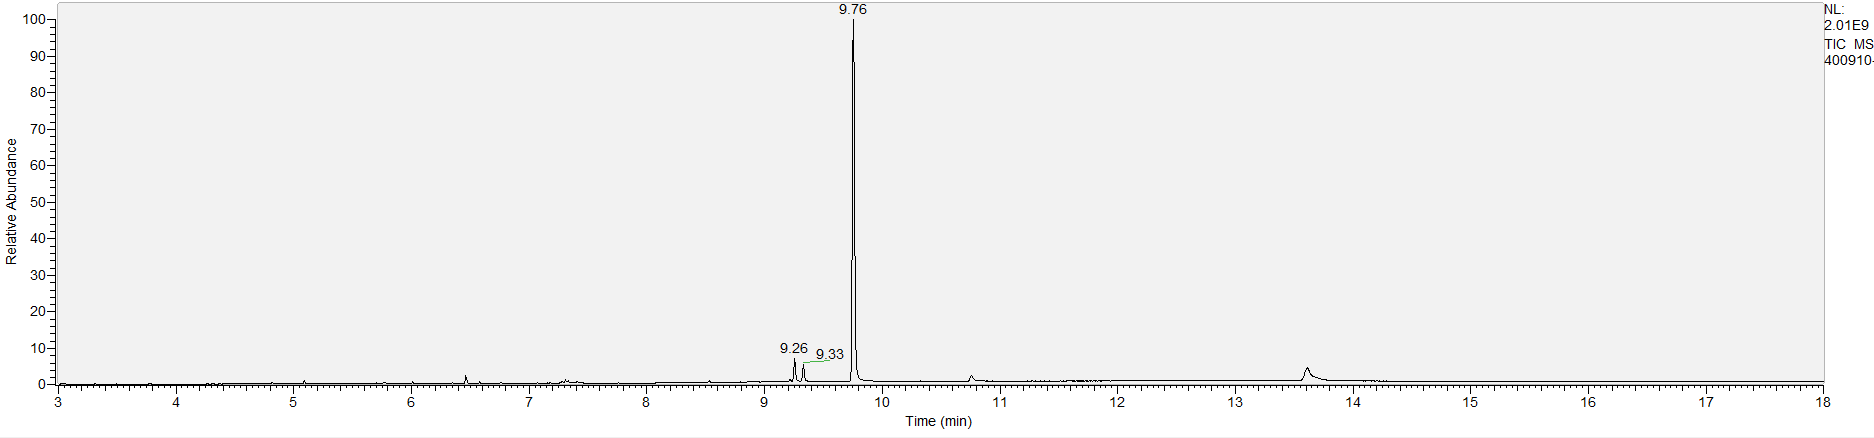
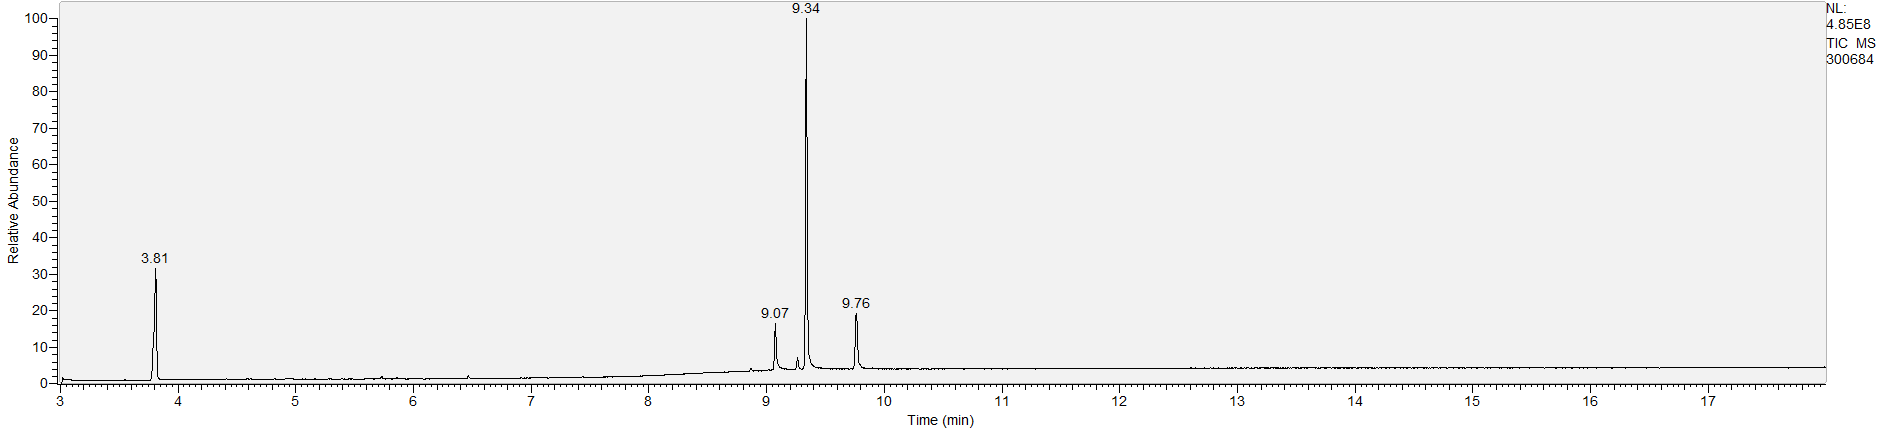
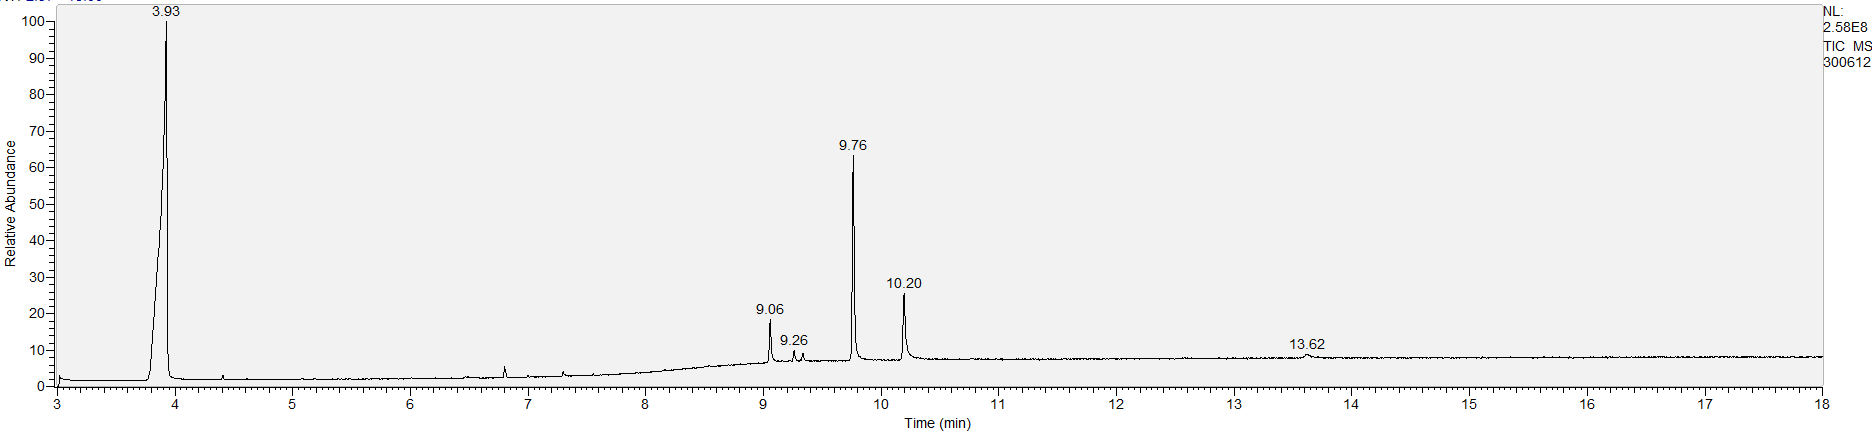
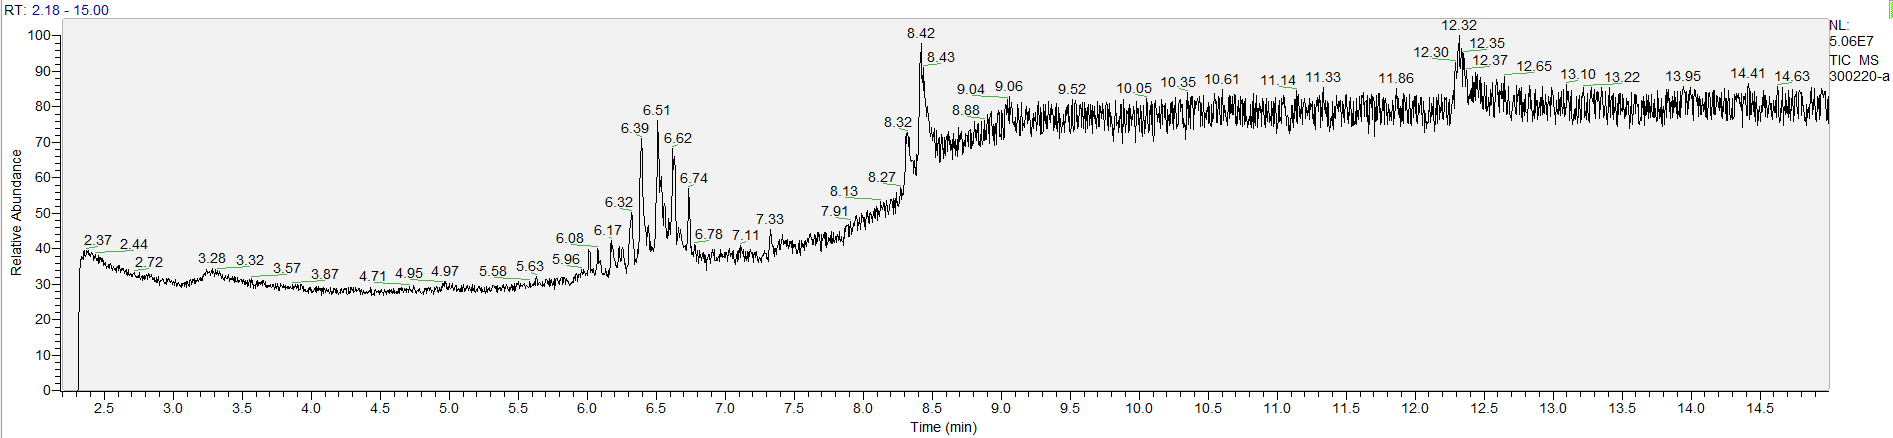
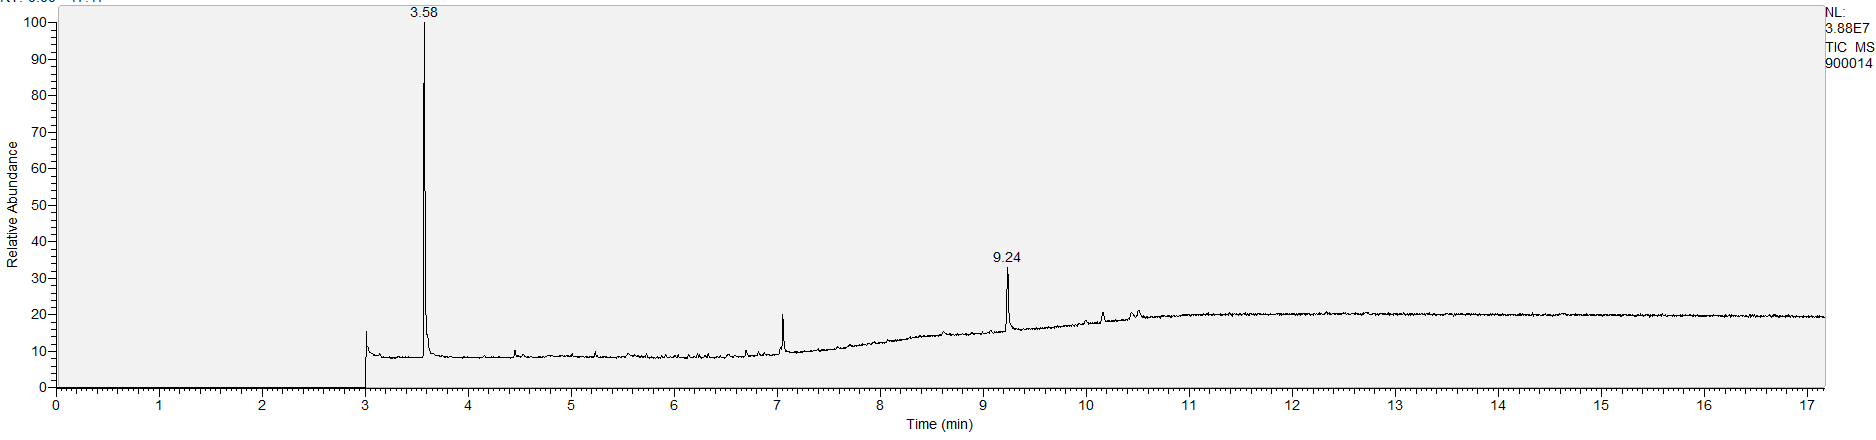
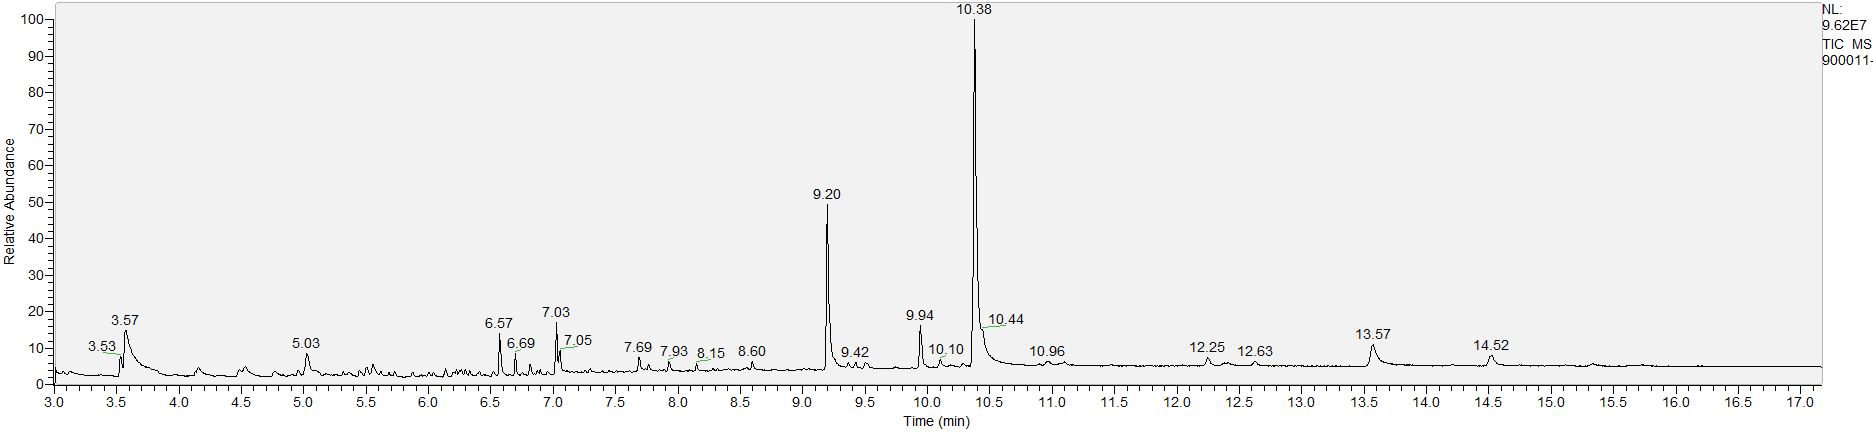
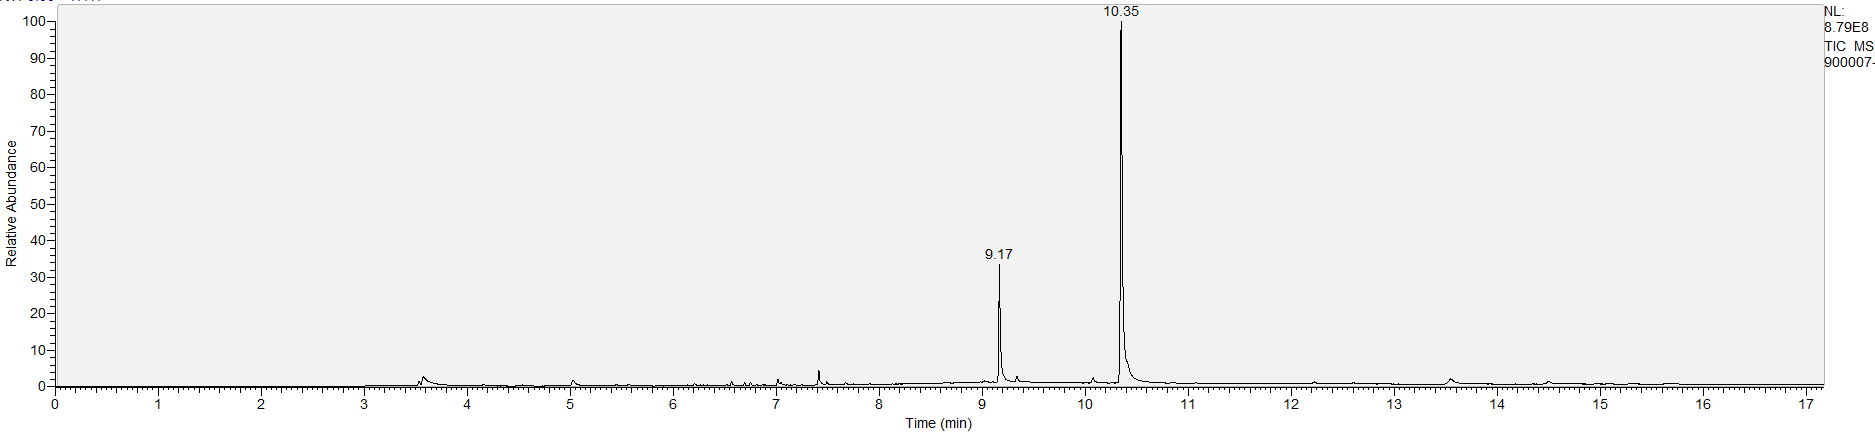
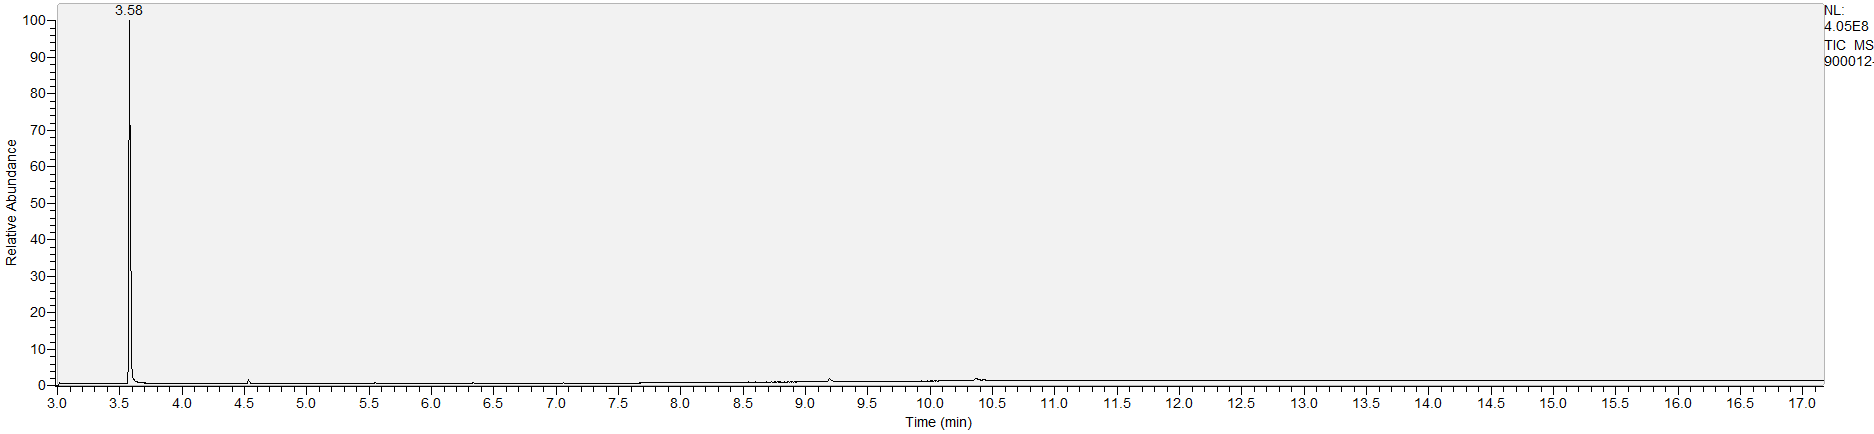
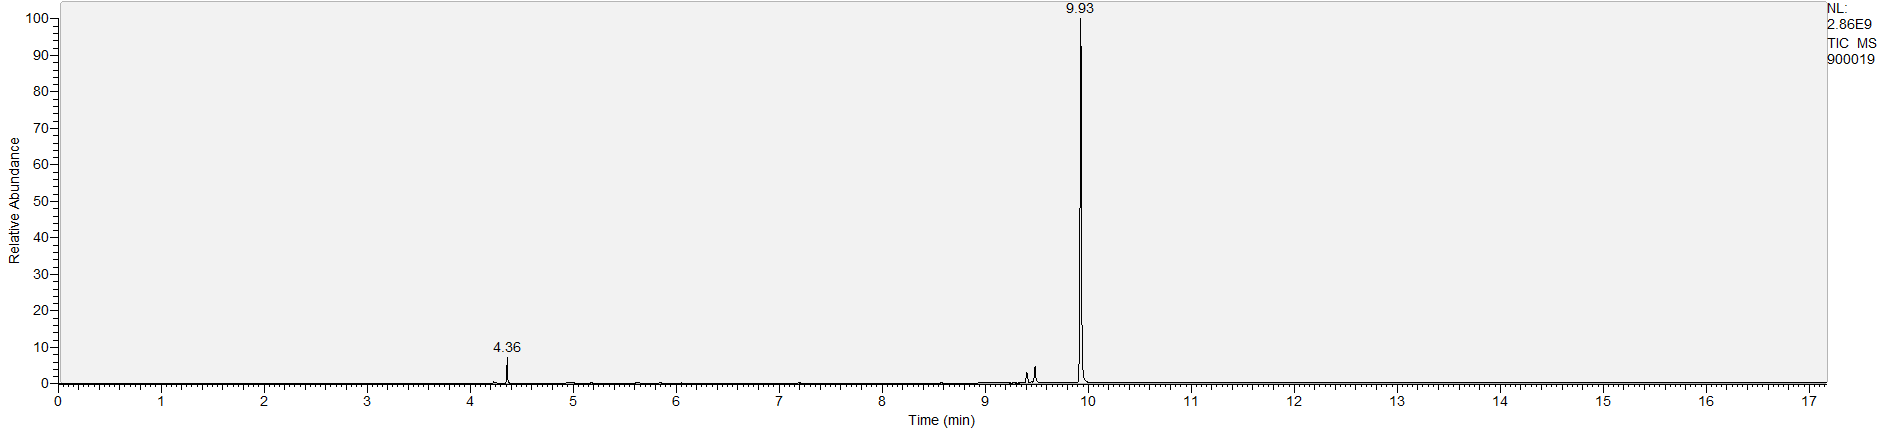
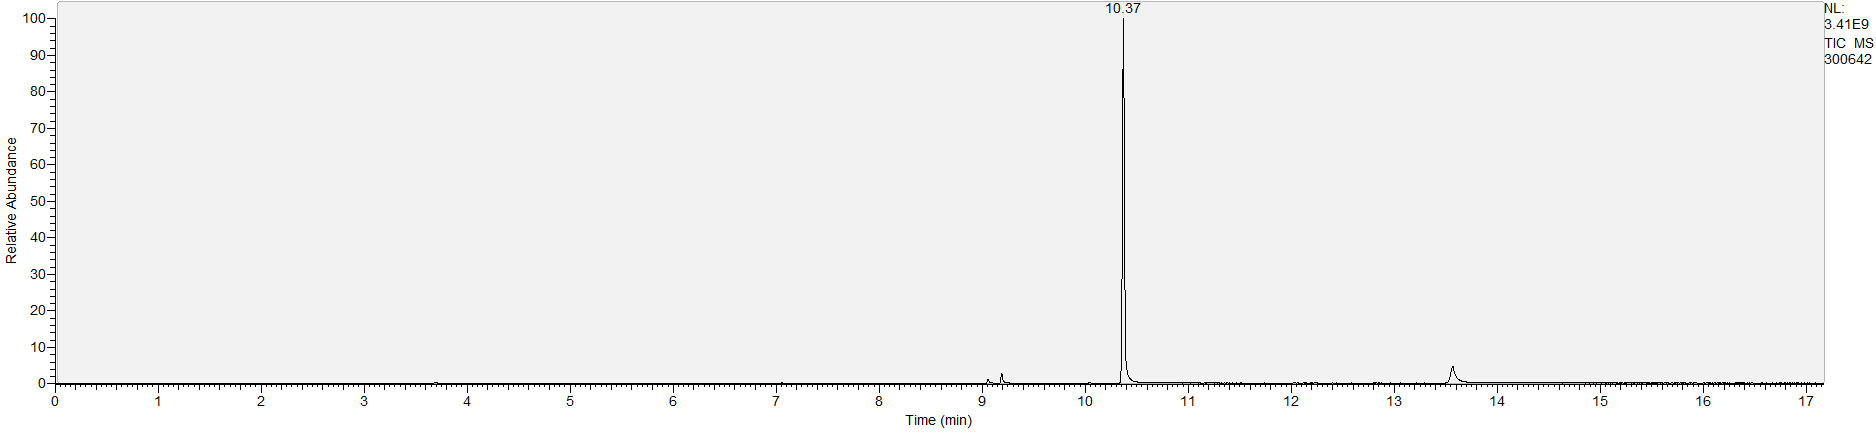
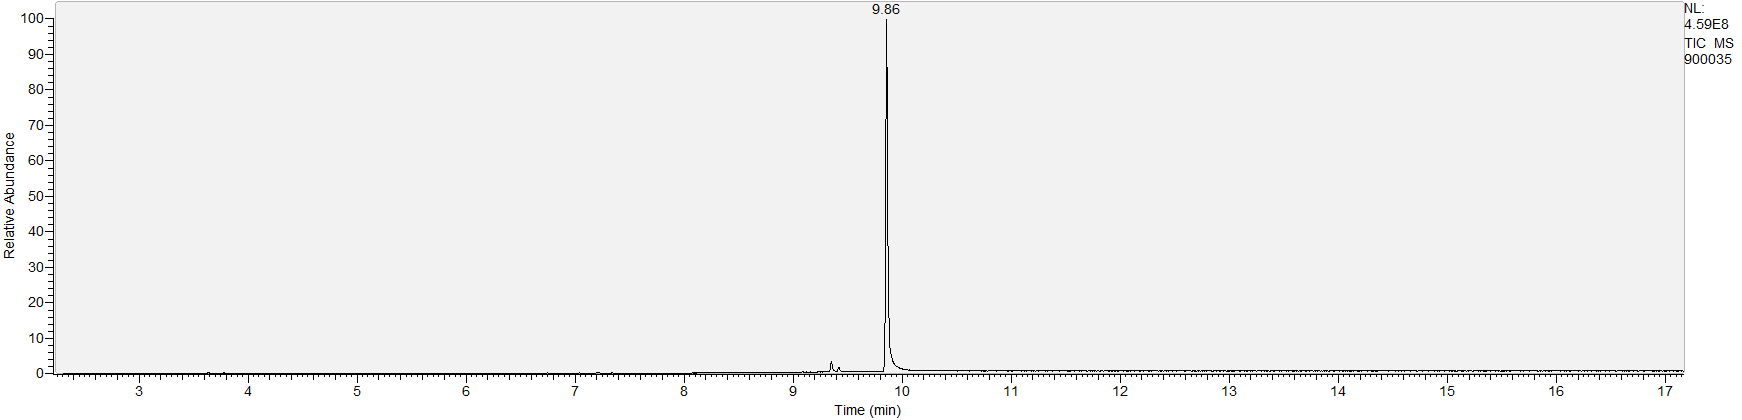
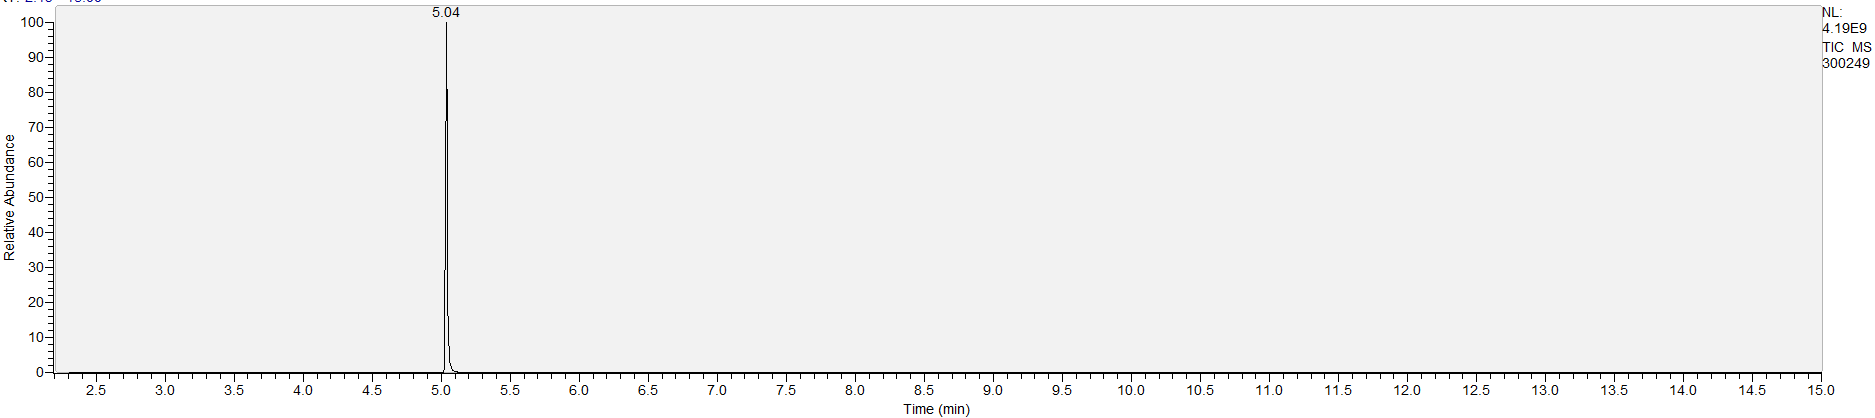
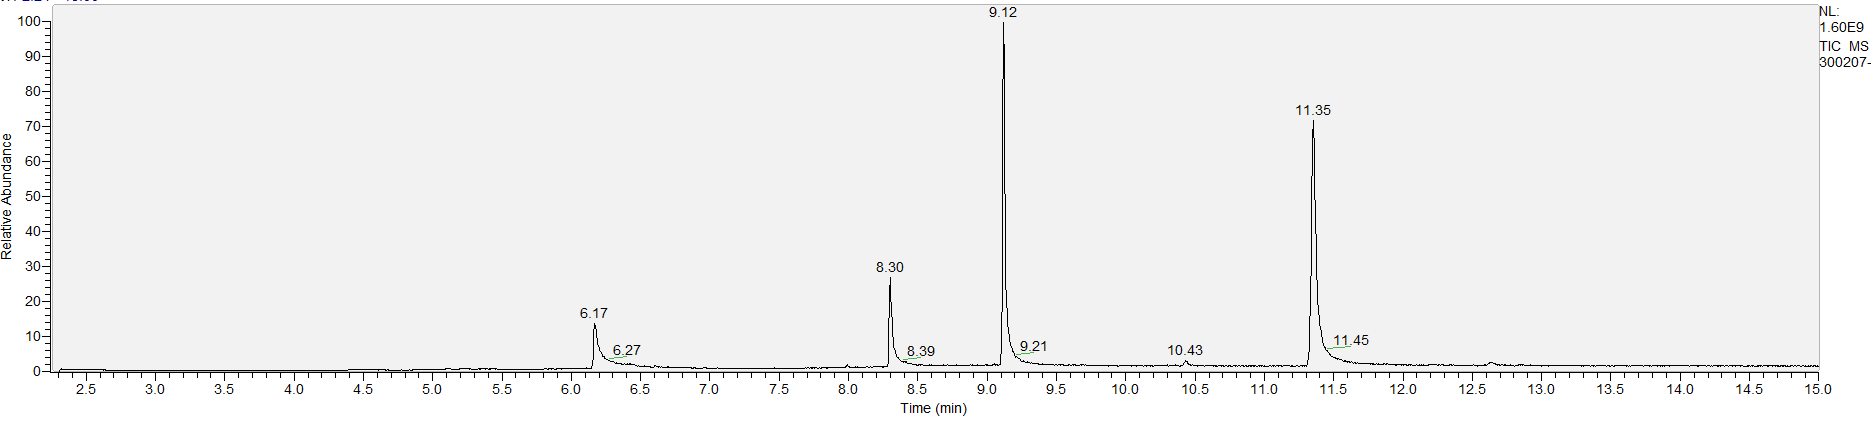
How to Read Result Graphs
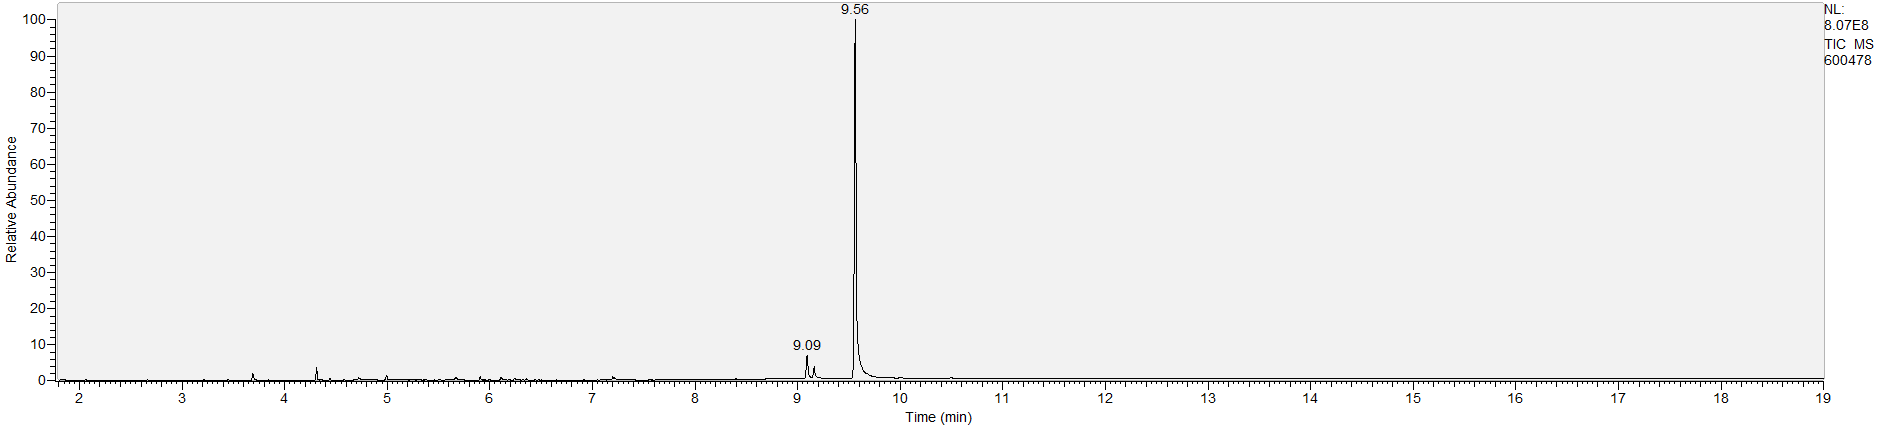
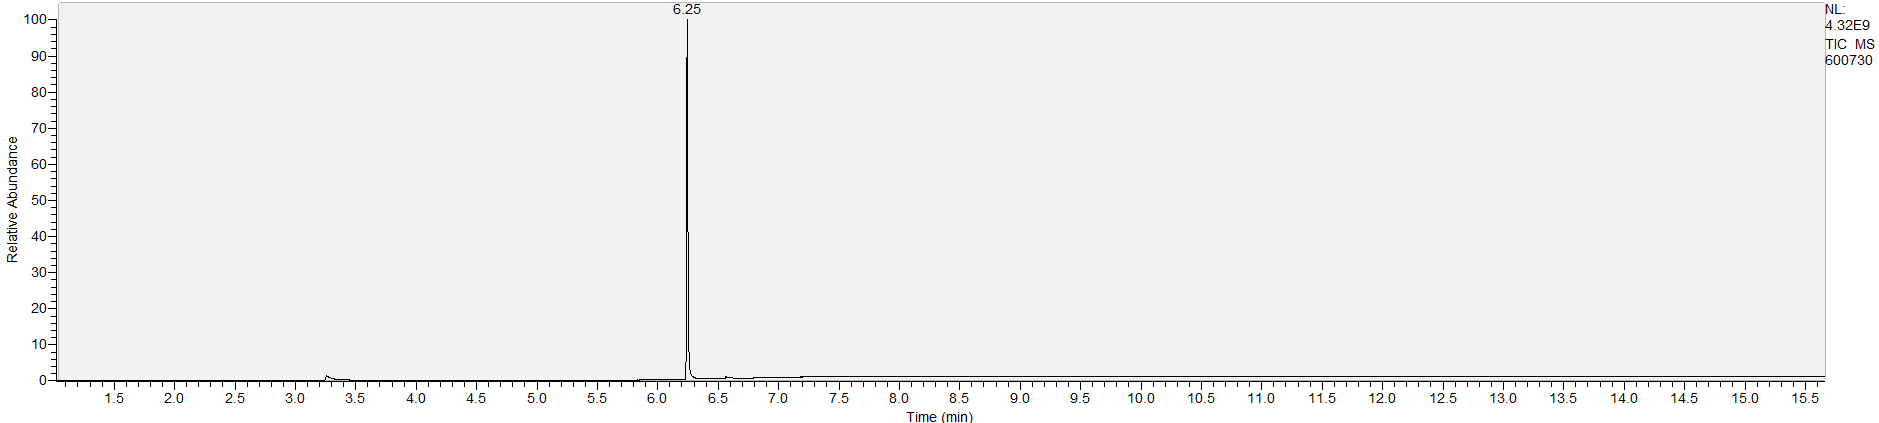
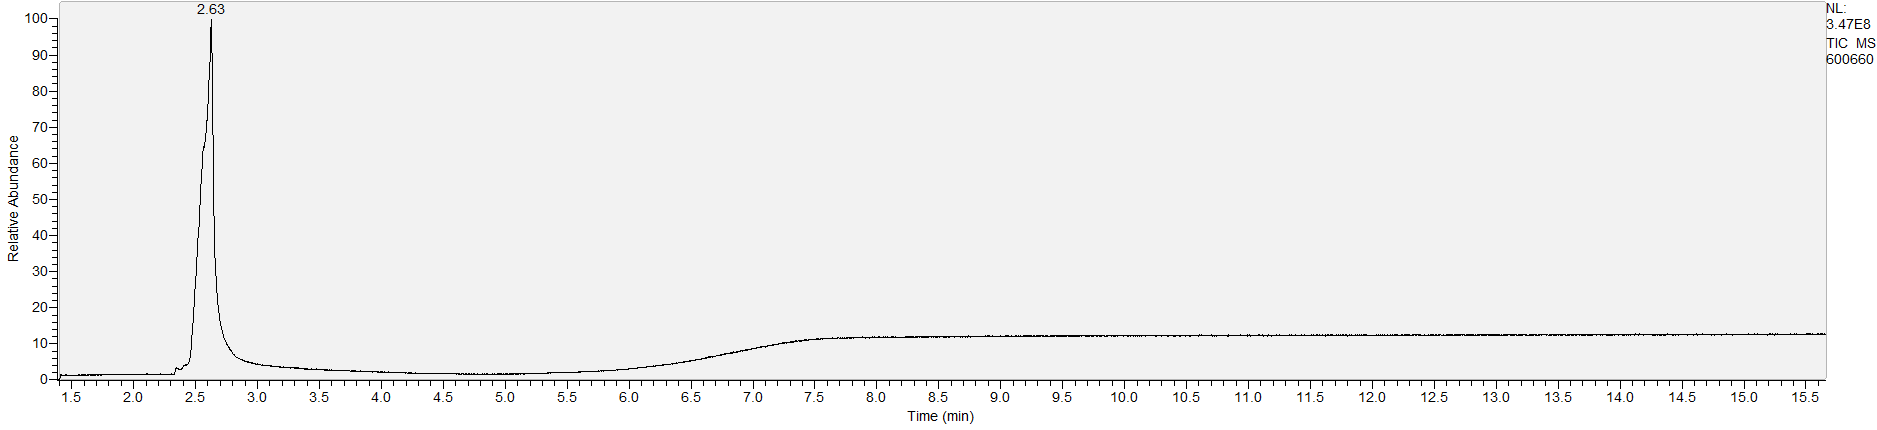
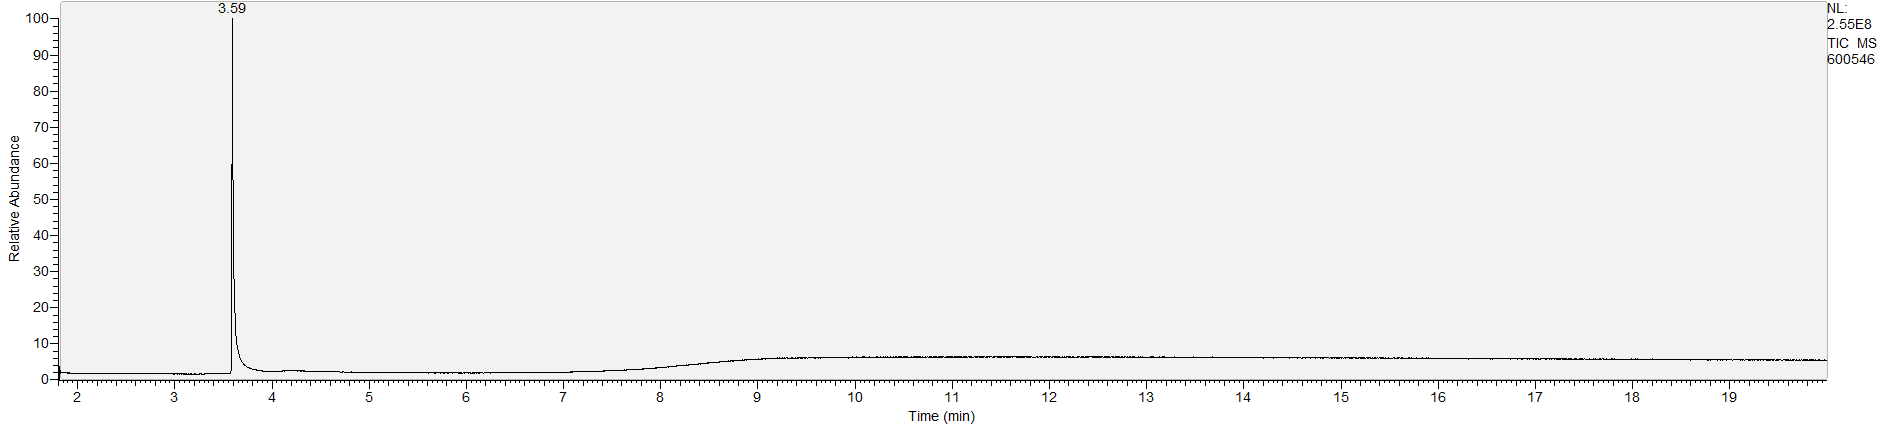
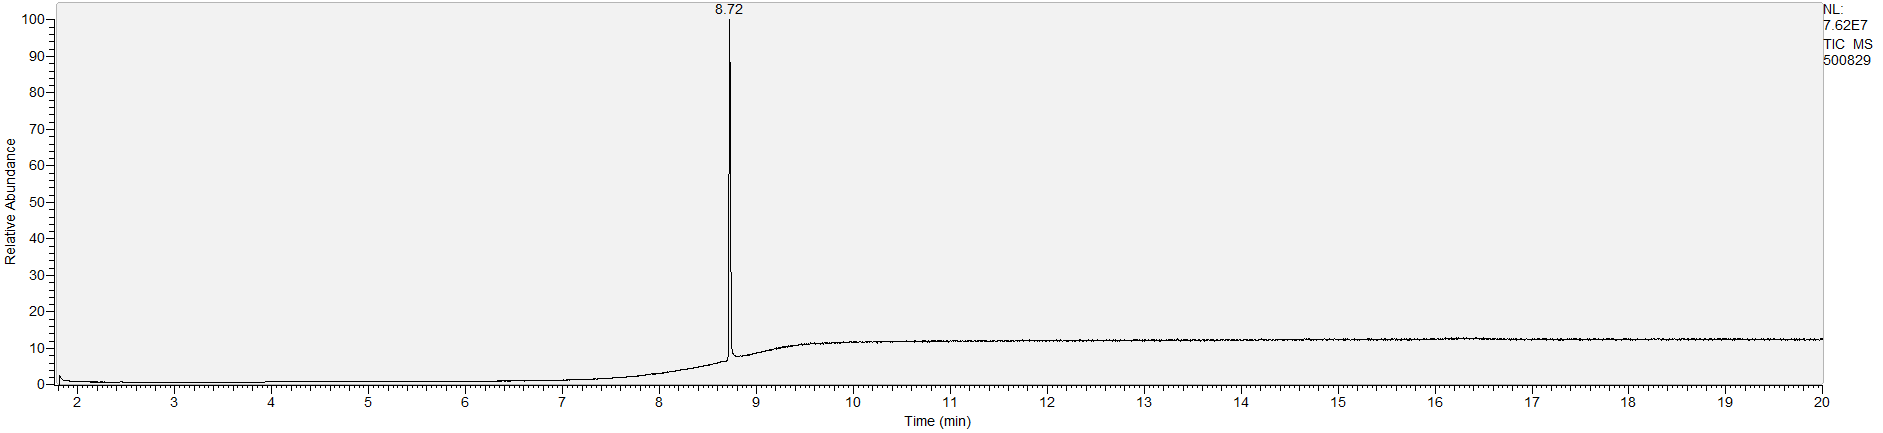
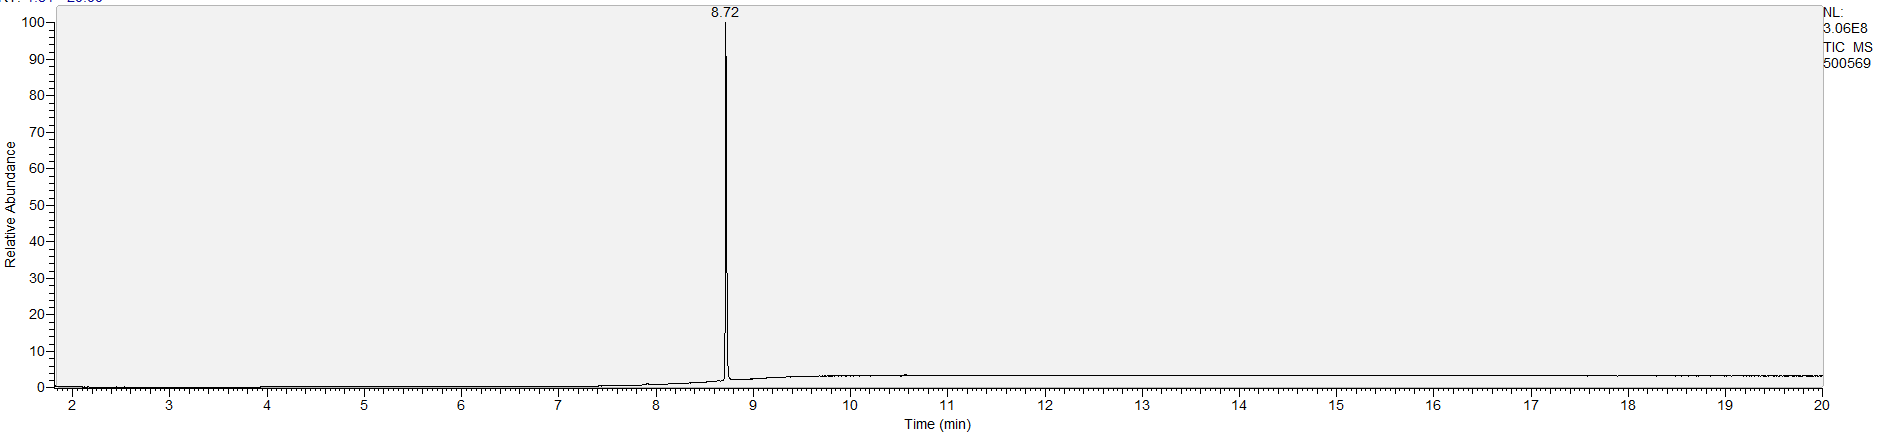
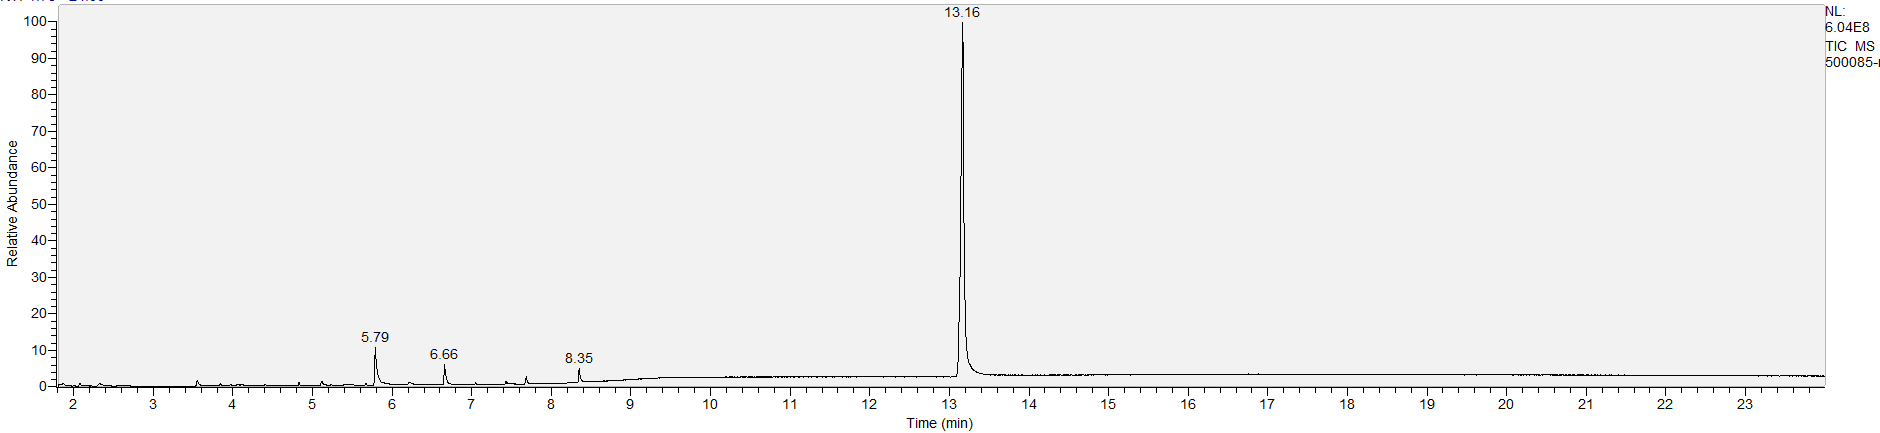
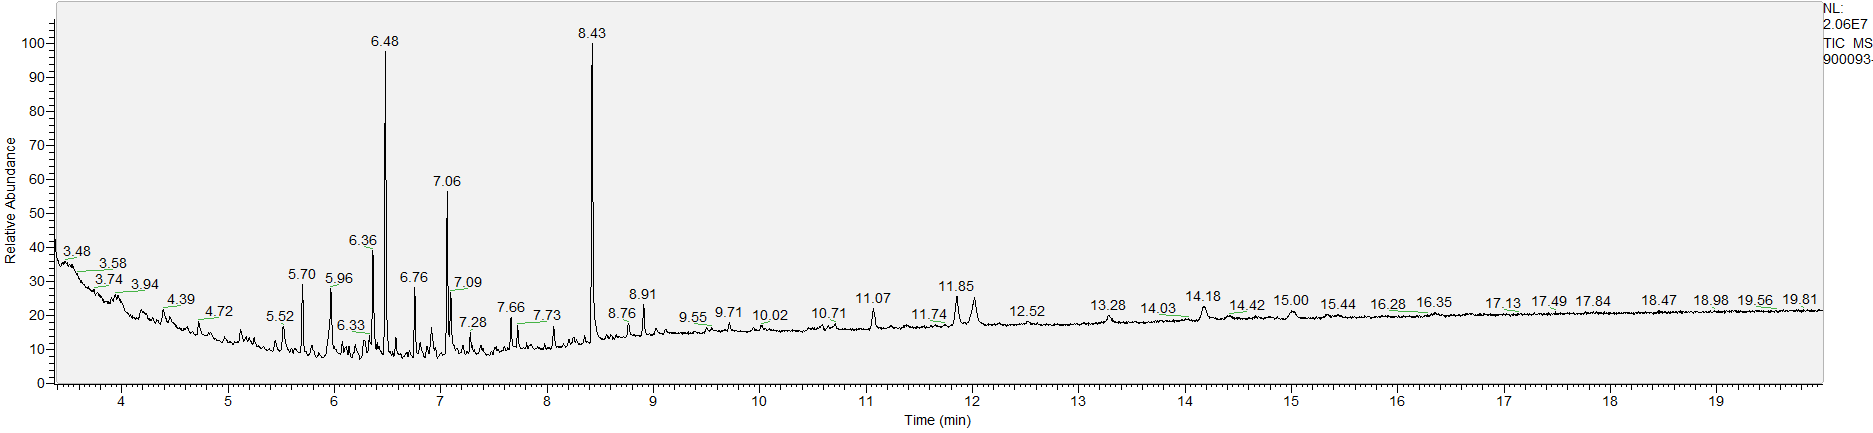
A sample's chromatogram is its visual fingerprint. Each substance in the drug mix is usually represented by a separate peak, so more peaks means more substances. This is important: This method does not provide purity or quantification, and the height of the peaks just gives a rough idea of how much is in there. Tall peaks are the major components, and smaller blips are trace amounts.
Reading the graph. The "relative abundance" on the vertical axis is a rough relative estimate of how much is present. It is not quantification. The time (min) on the horizontal axis means the time at which each of the substances was detected. But you can also look at the overall pattern to get a sense of what's common in your area. Also, similar substances can sometimes clump together into one peak, so we may run more tests to get separation. When we list the substances above, we've taken a whole set of lab tests into account, and it's not just looking at results from one graph.
The GCMS method is really sensitive. We can pick up on trace amounts, and sometimes those can be cross-contamination. They may not be relevant for your context, but know that’s what we found in there. That's why we ask you to wear gloves and use the paper cloth when collecting the sample. The substances that drive the high are in the major peaks. Sometimes there can be side effects from the smaller peaks as well.
What the peak numbers mean. The peak numbers are provided for transparency and completeness. The peak number is when (in minutes) the GCMS machine to identify the substance. The number itself isn’t all that important by itself - think of it like a label. If advanced methods (see below) were used, the peak numbers may not match up exactly. And some smaller peaks may be artifacts that we investigated and ruled out.
What we can and can't tell. The GCMS method is most reliable for psychoactive substances. For cuts and fillers (like sugars) we may need to use other tools. If you see "FTIR" or "Derivitized GCMS" in the Methods description above, we found additional substances when we used one of these advanced techniques. The graph above doesn’t include the peaks from these advanced methods right now because the graphs are too complicated.