 Image 1 of 1
From Seattle, Washington on 11/10/2023
Assumed to be methamphetamine
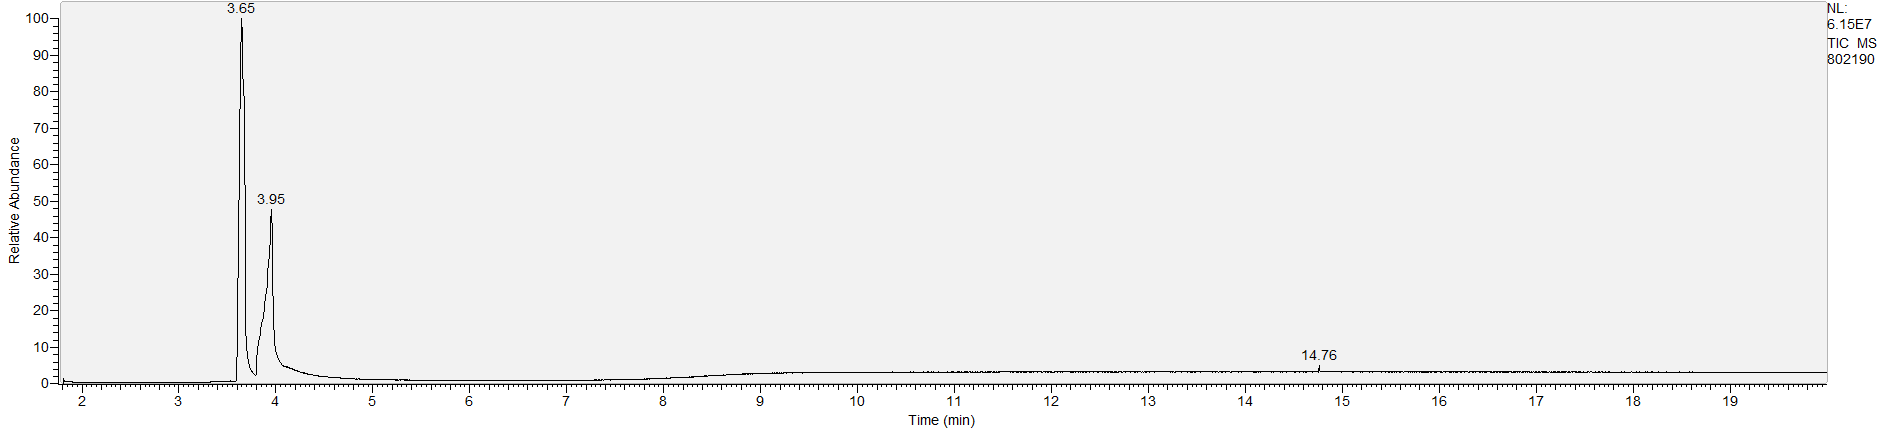
Only 1 major substance detected:
Looks = clear crystals
Need free supplies and advice to keep you safe? Find your nearest harm reduction program at harmreduction.org
Major substances in graph:
From Seattle, Washington on 11/10/2023
Assumed to be methamphetamine
Only 1 major substance detected:
Looks = clear crystals
Need free supplies and advice to keep you safe? Find your nearest harm reduction program at harmreduction.org
Major substances in graph: